How to make a dumbbell chart for before and after
Updated 8 Nov 20262 min read
To make a dumbbell chart, choose Dumbbell in the GeoLens studio, pick an indicator and the countries, set the two years and download a PNG. Each country gets one row, with a dot for the first year and an arrowhead or a second dot for the last.
What a dumbbell or arrow chart shows
Each country gets one row on one shared axis: a dot for the first year, a mark for the last and a line between them. The length of the line is the change.
Here the hollow dot is 2005 and the arrowhead is 2025. The rows are ranked by the change, so Malta's gain of 25.9 points leads, and Finland, Portugal, Romania and Slovenia, the four that fell, close the list.
Arrow chart of the share of women aged 15 and over in the labour force in the 27 EU members, one row per country from 2005 to 2025, ranked by the change, with Malta highlighted.
How to make a dumbbell chart, step by step
Seven steps, from an empty studio to the PNG. Each picture shows the control to use, ringed in gold.
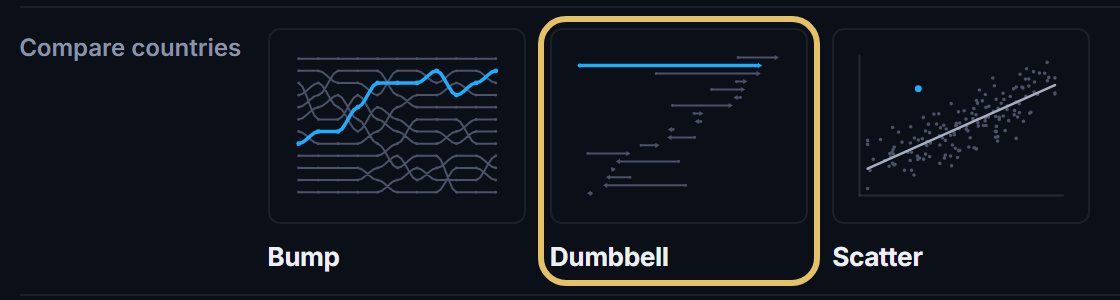
Open geolens.eu/create and choose Dumbbell, under Compare countries.
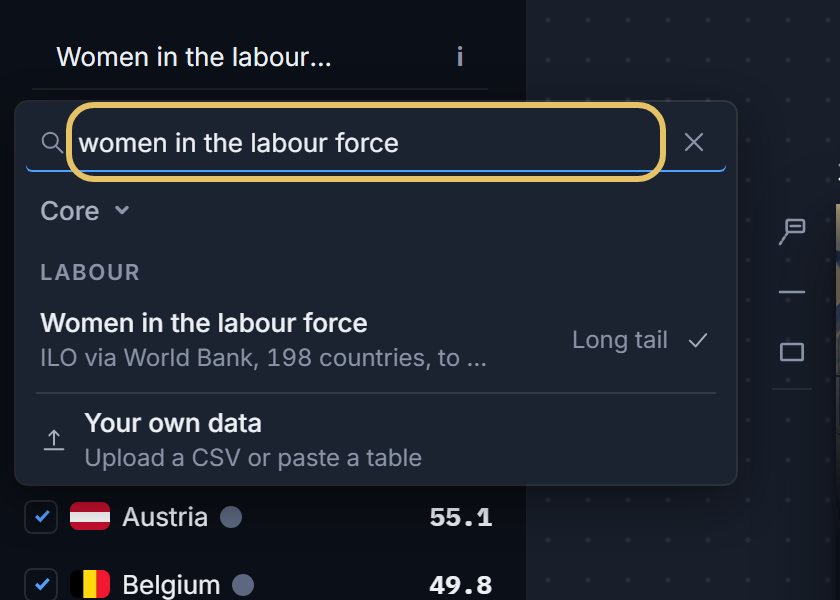
Press the indicator name at the top left and search for your measure, such as women in the labour force.
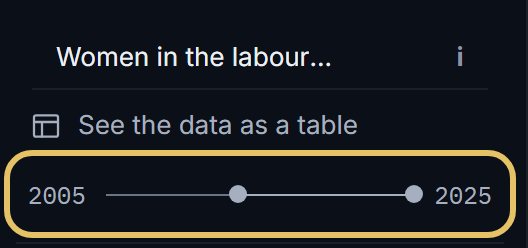
Drag the two ends of the year range. The left end starts every row, the right end finishes it.
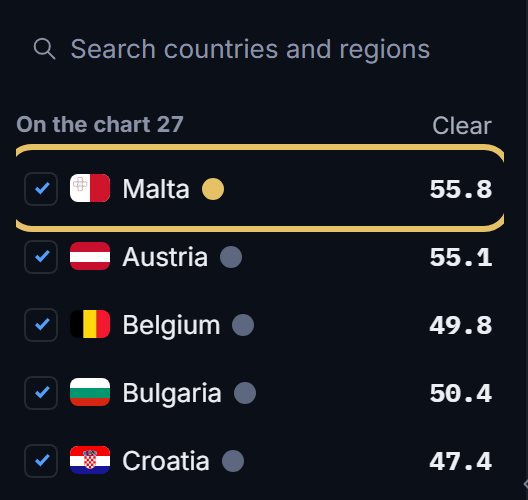
Tick the countries that make the rows. The first in the list wears the gold highlight, so drag your story's country to the top.
Press Ends to put an arrowhead or a dot on the last year, and to choose whether falls show in red.

Press Rows to sort by the change. High first leads with the biggest rises, Low first turns the order round.

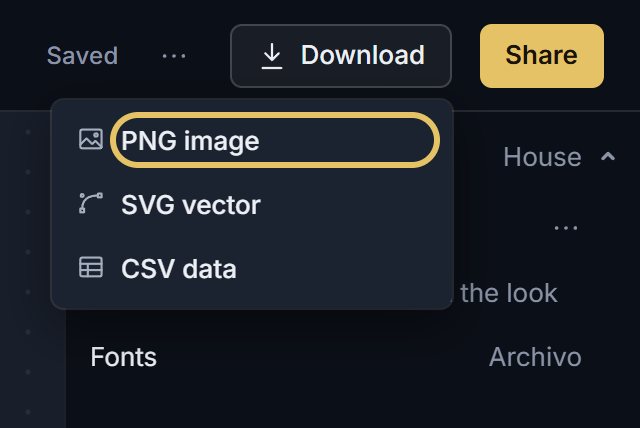
Open Download and choose PNG image. PNG comes with a free account, SVG vector with PLUS.
TipSort the rows by the change or by the end value, never by the alphabet.
Make a dumbbell chart easy to read
Keep one axis for every row. It does not need to start at zero, because the reader judges position and distance, not the length of a bar.
Give the accent to one country and keep the rest quiet.
When a fall is good news, such as fewer infant deaths, turn Falls in red off.
When another chart is better
Two dots hide the years between them, so a country that fell and recovered looks like a small change.
This line chart shows the risk. A dumbbell of Ukraine from 1990 to the latest year would hide the fall of the 1990s. When the path is the story, use a line chart. When the order is the story, use a bump chart.
Line chart of real GDP per person in Poland and Ukraine, indexed to their 1990 level, with Poland's EU entry, the annexation of Crimea and the full-scale invasion marked.