How to make a heatmap of countries by year
Updated 8 Nov 20262 min read
To make a heatmap of countries by year, choose Heatmap in the GeoLens studio, pick an indicator and the countries, set the years and download the chart. Each country is a row, each year a column, and a cell's colour is its value.
What a heatmap of countries by year shows
Read a row from left to right for one country's history, or a column from top to bottom for one year across every country. A heatmap fits many countries and a long window into one frame, where that many lines would cross and crowd.
This one sets Bulgaria against the other 26 EU members from 1990 to 2025. Zero is a named cut in the key, so growing and shrinking years split at a glance.
Heatmap of annual population growth for the 27 EU members, one row per country and one column per year from 1990 to 2025, with Bulgaria's row highlighted.
How to make a heatmap, step by step
Eight steps, from an empty studio to the image file. Each picture shows the control to use, ringed in gold.
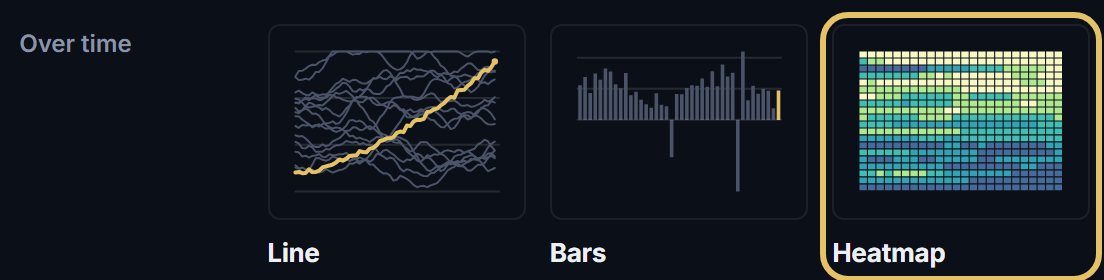
Open geolens.eu/create and choose Heatmap, under Over time.
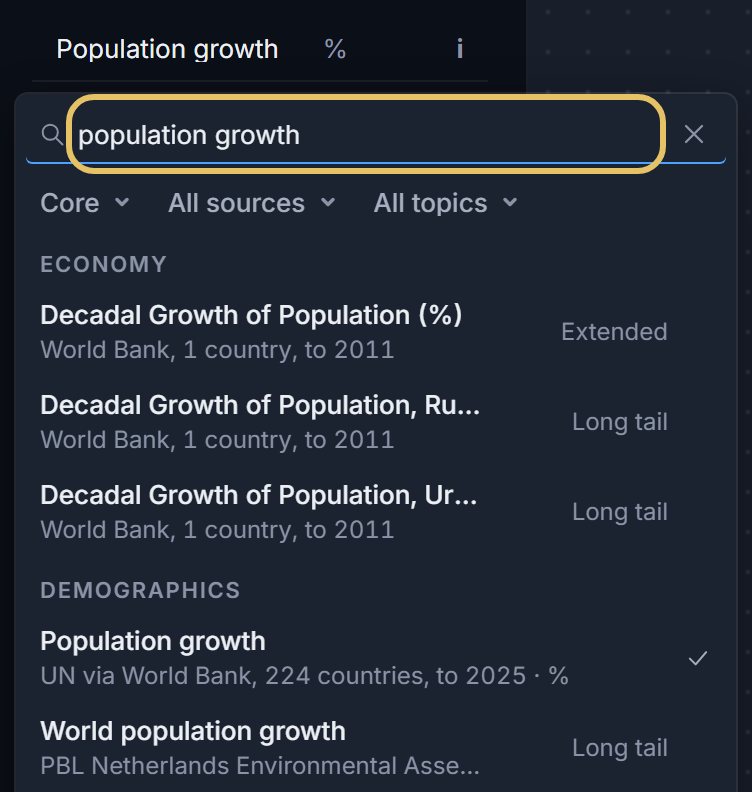
Press the indicator name at the top left and search for your measure, such as population growth.
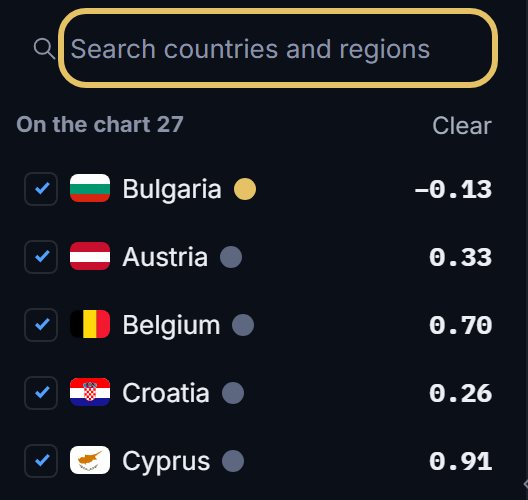
Search for each country and tick it. Each one becomes a row, and the first in the list is the highlighted row.
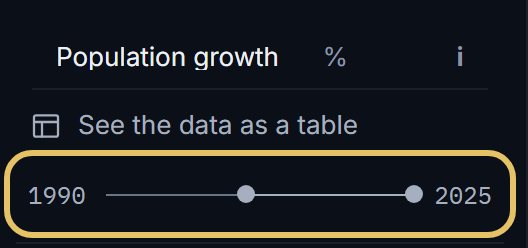
Drag the year range to set the first and last year. Each year becomes a column.
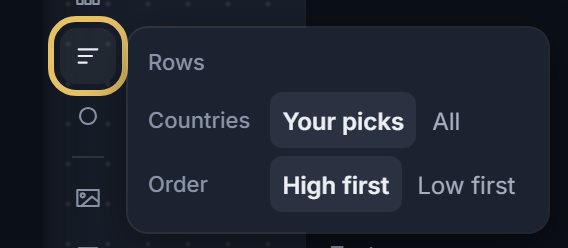
Open Rows to show your picks or all countries, ranked high first or low first.
Keep Values on and set a window of 11 years or fewer: the cells then print their figures where they have room.
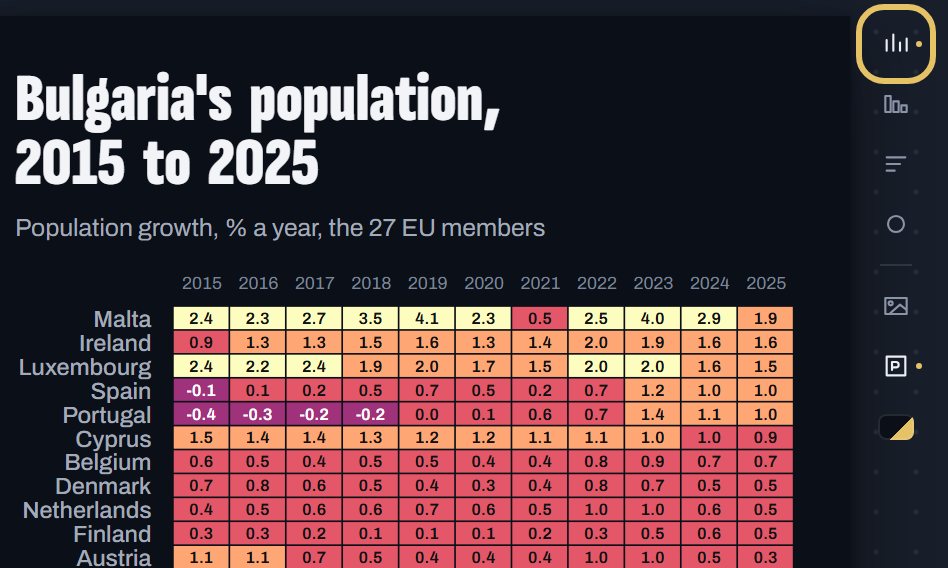
Press the title on the chart and type the finding, so the reader knows what to look for.

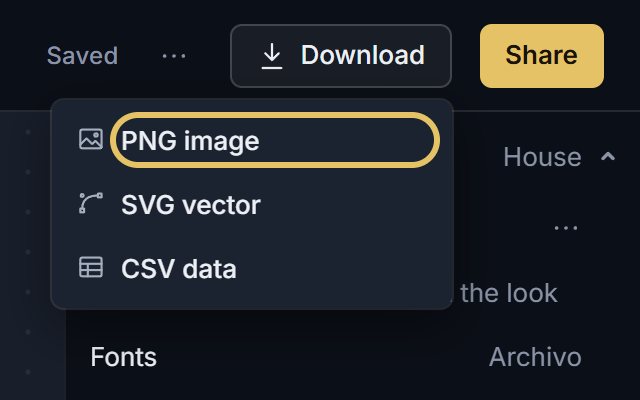
Open Download and choose PNG image. SVG vector comes with PLUS.
TipUse Log breaks when values span orders of magnitude, such as population or GDP.
Get the colours and the rows right
GeoLens sorts the values into five classes on round breaks and names every cut in the key. A far tail is clamped into the top class, so one extreme value does not wash out the rest.
Colours, beside the chart, picks the ramp and turns on Log breaks and Reverse.
Ranked rows put similar countries next to each other, so bands of colour form and the exceptions show. Rows set to All draws up to 30 countries.
When a line chart is better
With a handful of countries, use lines. Position on an axis reads more exactly than colour, and a line shows how steep a change is.
These small multiples put the same indicator on four line panels. Niger still grows more than 3% a year, India has slowed to under 1%, and the slopes show how fast each one slowed.
Small multiples of annual population growth from 1990 to 2023, one panel each for Niger, India, China and Japan.