Chart sizes for LinkedIn, Instagram and X
Updated 8 Nov 20261 min read
Use 1080 by 1350 pixels, a 4:5 portrait, for LinkedIn and Instagram posts, and 1080 by 1920 for stories. In the GeoLens studio, the frame button under the chart switches between Post, Link card, Story and Document.
Which image size each platform shows best
Each feed shows some shapes whole and crops or shrinks the rest. A cropped chart loses its title or its source, so pick the frame before you design.
The table
| Where it goes | Shape | Size | GeoLens frame |
|---|---|---|---|
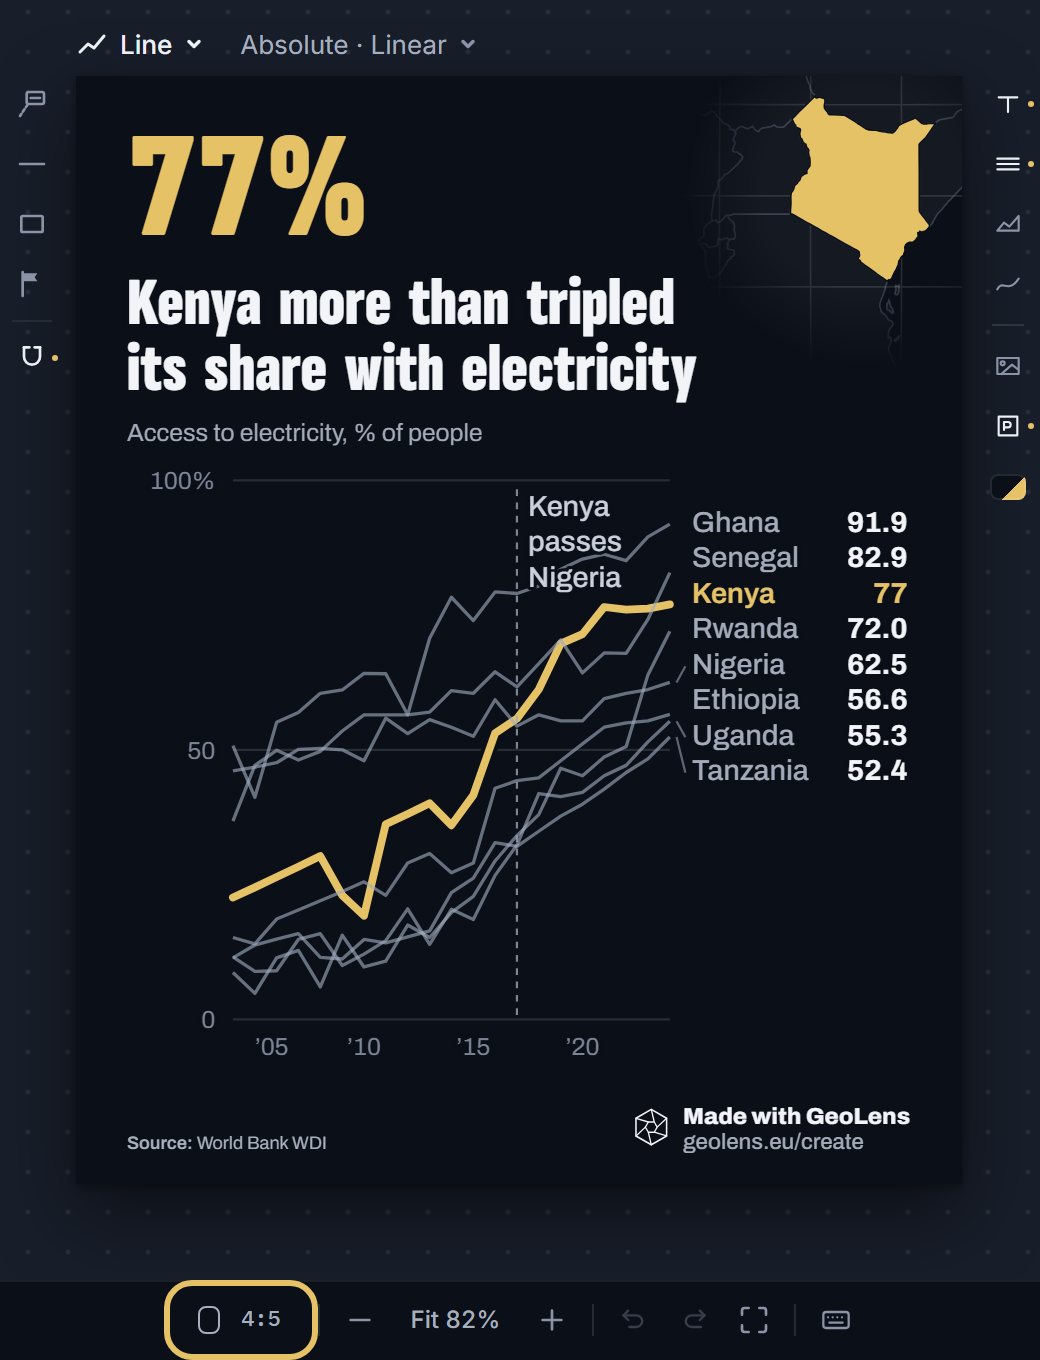
| LinkedIn and Instagram feed | 4:5 portrait | 1080 x 1350 | Post |
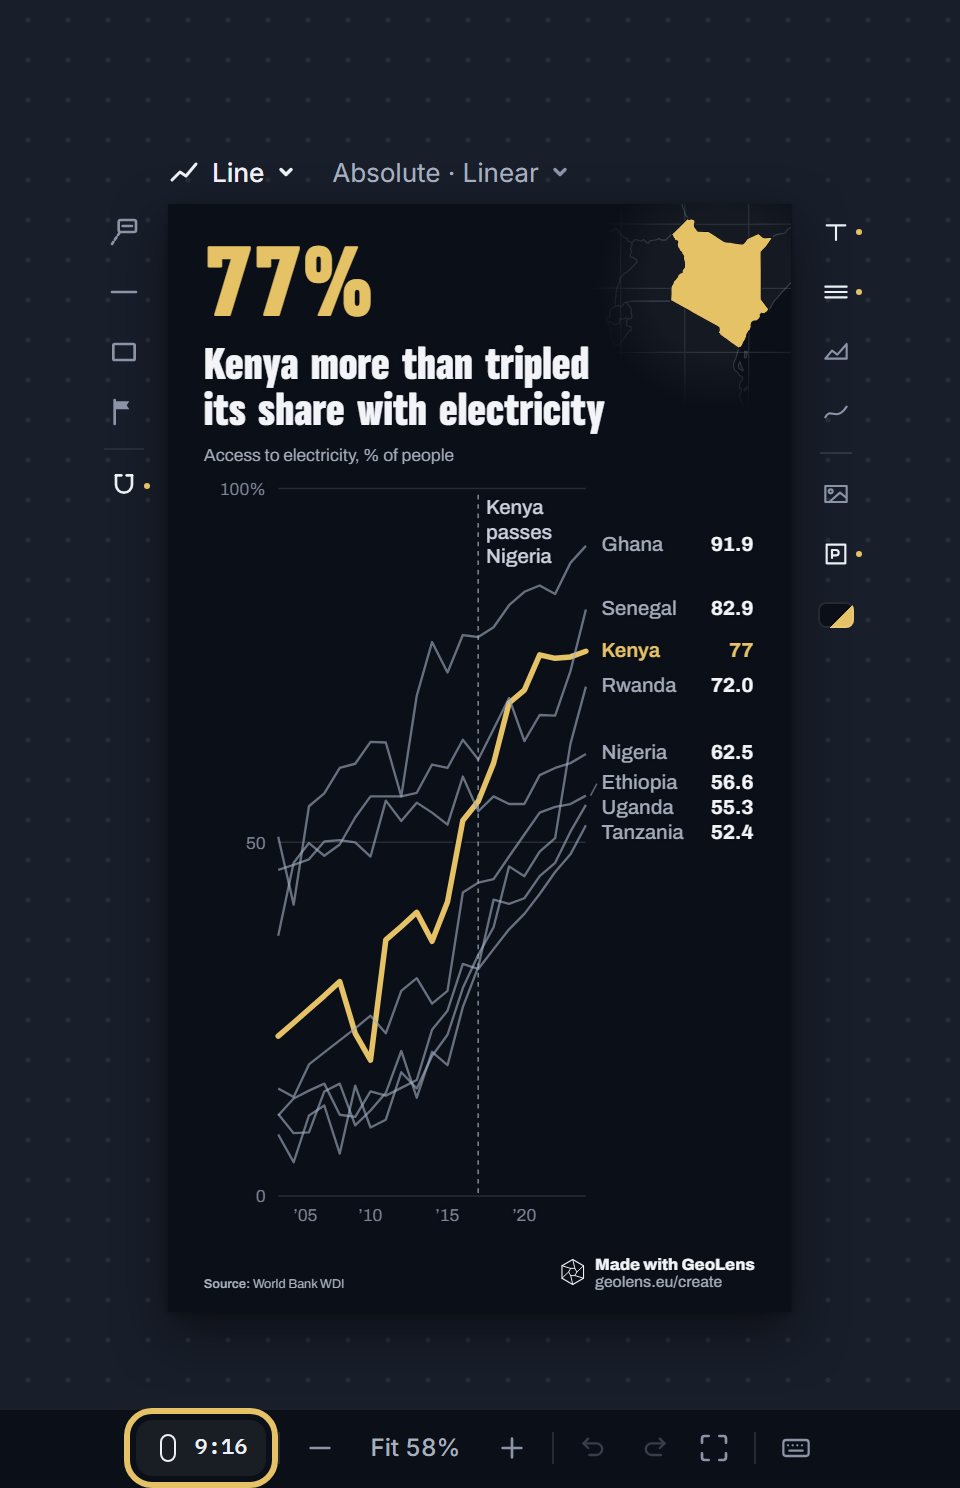
| Instagram, LinkedIn and TikTok stories | 9:16 | 1080 x 1920 | Story |
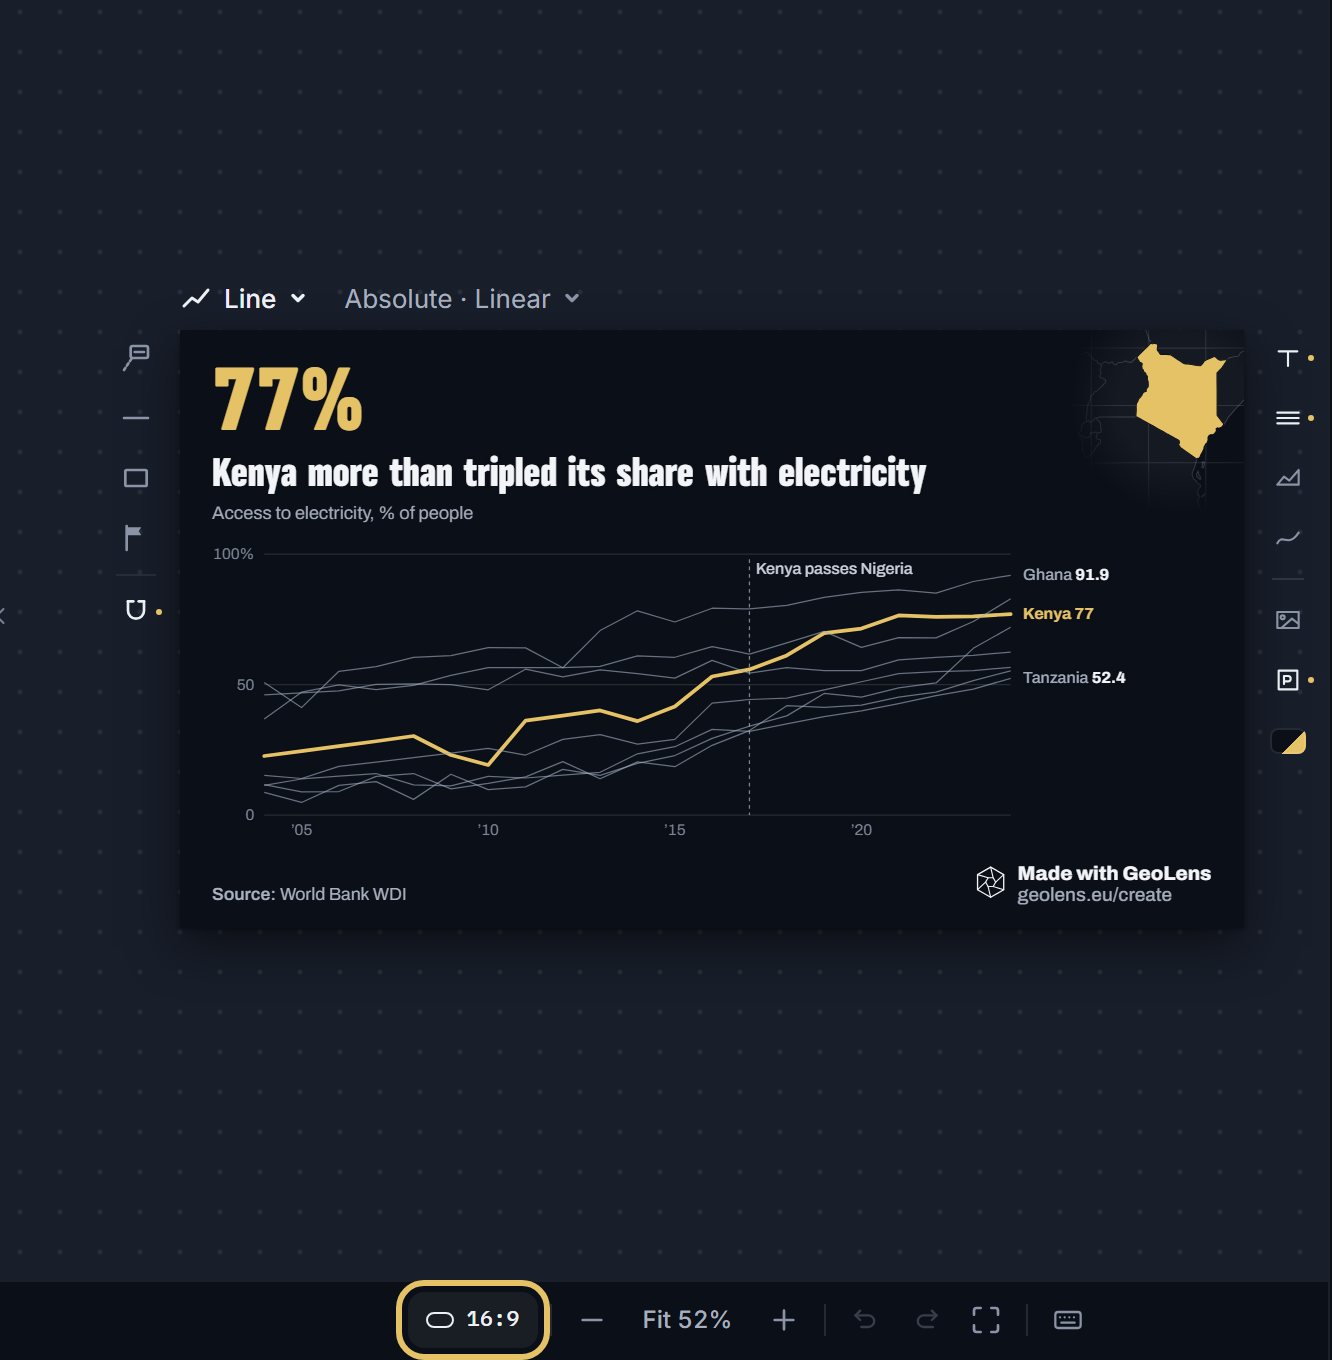
| X timeline | 16:9 landscape | 16:9 | Link card |
| Article, report or slide | Any | Your choice | Document |
One chart, every shape
The chart redraws for each frame: the title, the labels and the plot move, the data does not. Open this page on a phone and the chart below draws its 4:5 layout; on a wide screen it is 16:9.
Line chart of GDP per person in South Korea and Japan since 1970 on a log scale, with South Korea passing Japan.
How to size a chart for social media, step by step
Four steps on one chart, from the feed post to the file. Each picture shows the control to use, ringed in gold.
Open your chart in the studio. It starts in the Post frame, 4:5, shown on the button under the chart.
Press the frame button once for the Link card, the wide 16:9 frame for X.
Press it again for the Story, the tall 9:16 frame for Instagram, LinkedIn and TikTok stories.
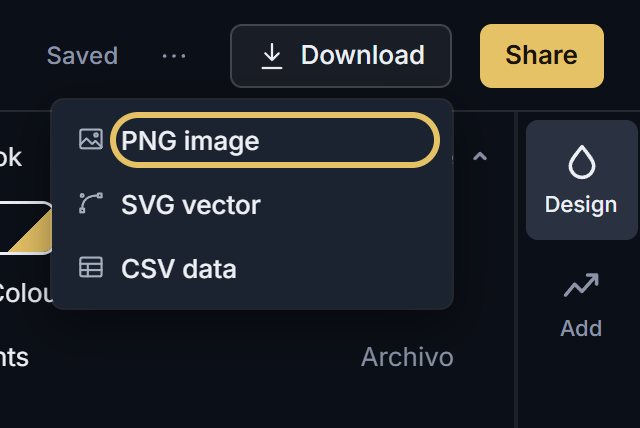
Open Download and choose PNG image for the frame you are in.
TipPut the finding in the title, so a reader who reads nothing else still gets the point.
Lay out a chart for a small screen
Use a few series with direct labels, not a legend. A tall frame leaves the plot narrow.
Keep the title, the key figure and the source in the middle of a story. The apps draw bars and buttons over the top, the bottom and the side.
Plan for compression
Every network recompresses what you upload. Hairline grids, pale fills and small grey text blur first.
Before you post, look at the file at phone size. If a label is hard to read there, it will be harder after upload.