Where to find free country data for charts
Updated 8 Nov 20261 min read
Start with World Bank Open Data for most country indicators, the IMF World Economic Outlook for forecasts and Eurostat for EU detail. For energy, use the EIA or Our World in Data; for emissions, Climate Watch. In GeoLens, you search indicators by name in the studio.
Six free sources for country data
Each asks you to credit it, and the terms differ, so read the last column before any commercial use.
The table
| Source | Best for | Licence |
|---|---|---|
| World Bank Open Data | Economy, population, health and education for every country | CC BY 4.0 |
| IMF World Economic Outlook | Growth, inflation and public finances, with projections | IMF terms; commercial reuse needs permission |
| Eurostat | Energy, prices and trade for EU members, candidates and EFTA | Free reuse with attribution |
| U.S. Energy Information Administration | Oil and gas production, use and exports for every country | Public domain |
| Our World in Data | Long-run series on energy, emissions and health | CC BY 4.0 |
| Climate Watch | Greenhouse gas emissions by country and gas | CC BY 4.0 |
A chart straight from World Bank data
This chart uses the World Bank series for real GDP per person, in constant dollars, indexed to 1990. Constant dollars compare an economy with its own past; current dollars mix in inflation.
Line chart of real GDP per person in Poland and Ukraine since 1990, indexed to 1990 = 100.
How to chart these sources, step by step
Five steps in the studio, with no file to download. Each picture shows the control to use, ringed in gold.
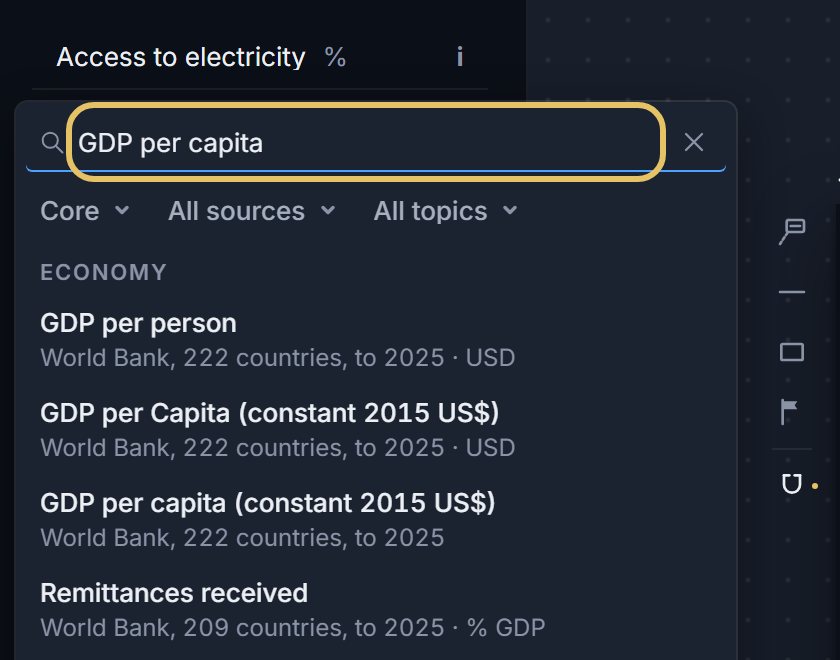
Press the indicator name at the top left and search by name, such as GDP per capita. Each result names its source, its countries and its latest year.
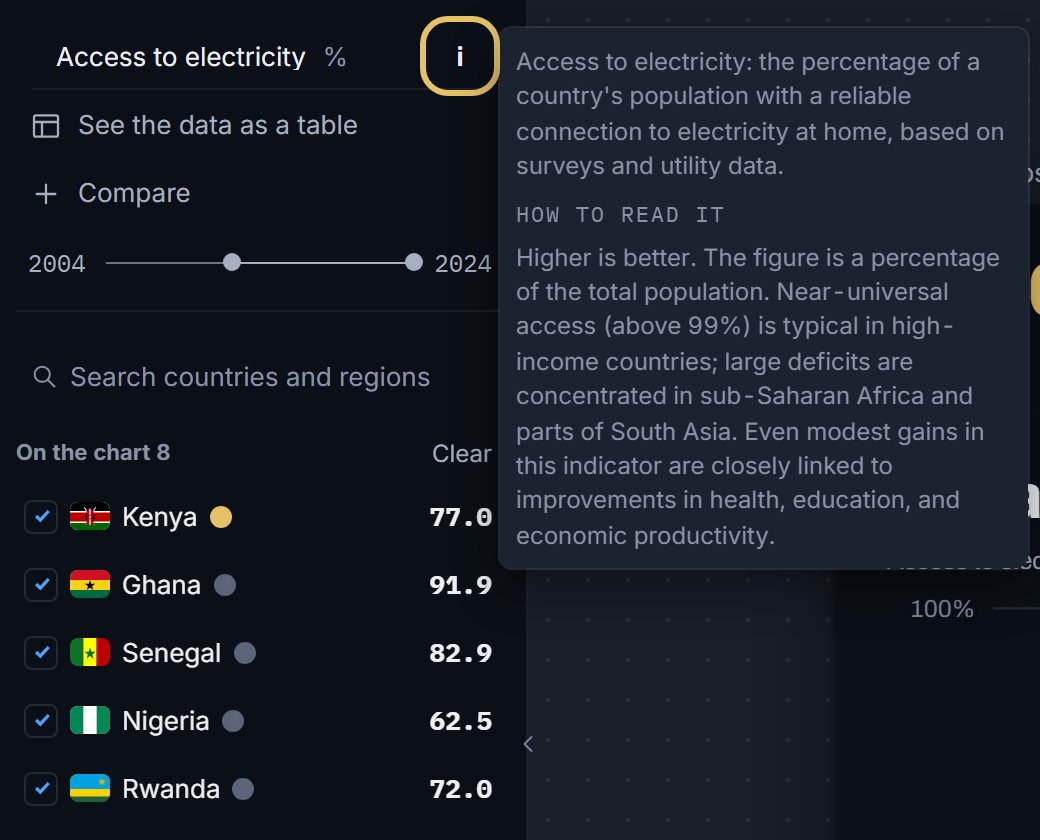
Press i to read what the series measures and how to read it.
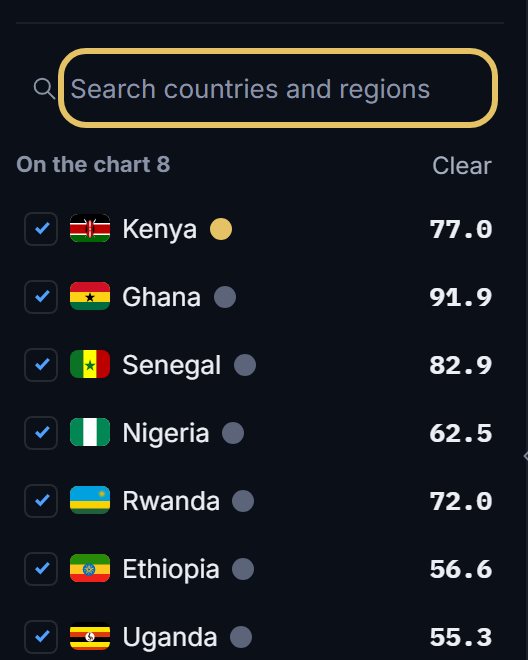
Search and tick the countries. Each shows its latest value beside its name.
The source line prints on the chart for you, such as World Bank WDI.

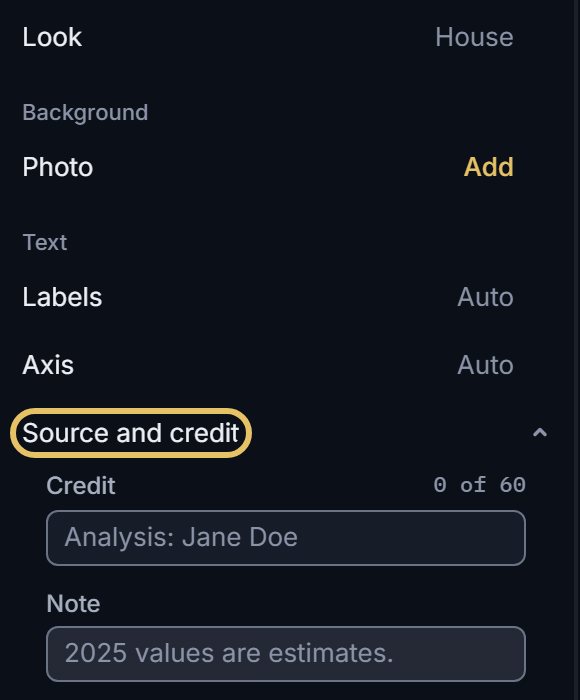
Open Source and credit to add your own credit and a note, such as which values are estimates.
TipRead who produced it, what it measures, the unit, the years and the licence.
Check a series before you chart it
Say which year the latest value is. Annual country data runs a year or more behind.
Credit the producer and the publisher, as in "IEA via World Bank WDI".
Show forecasts as forecasts
IMF projections run past the last actual year. Draw projected years differently, with a dashed line or a lighter colour, and say so in the subtitle.