How to make a choropleth map of country data
Updated 8 Nov 20262 min read
To make a choropleth map, choose Map in the GeoLens studio, pick an indicator, the year and the countries, then set the colours and download a PNG. Map a rate or a share, never a raw total.
What a choropleth map shows
Each country is filled with a colour that stands for its value, so the reader sees where high and low values cluster.
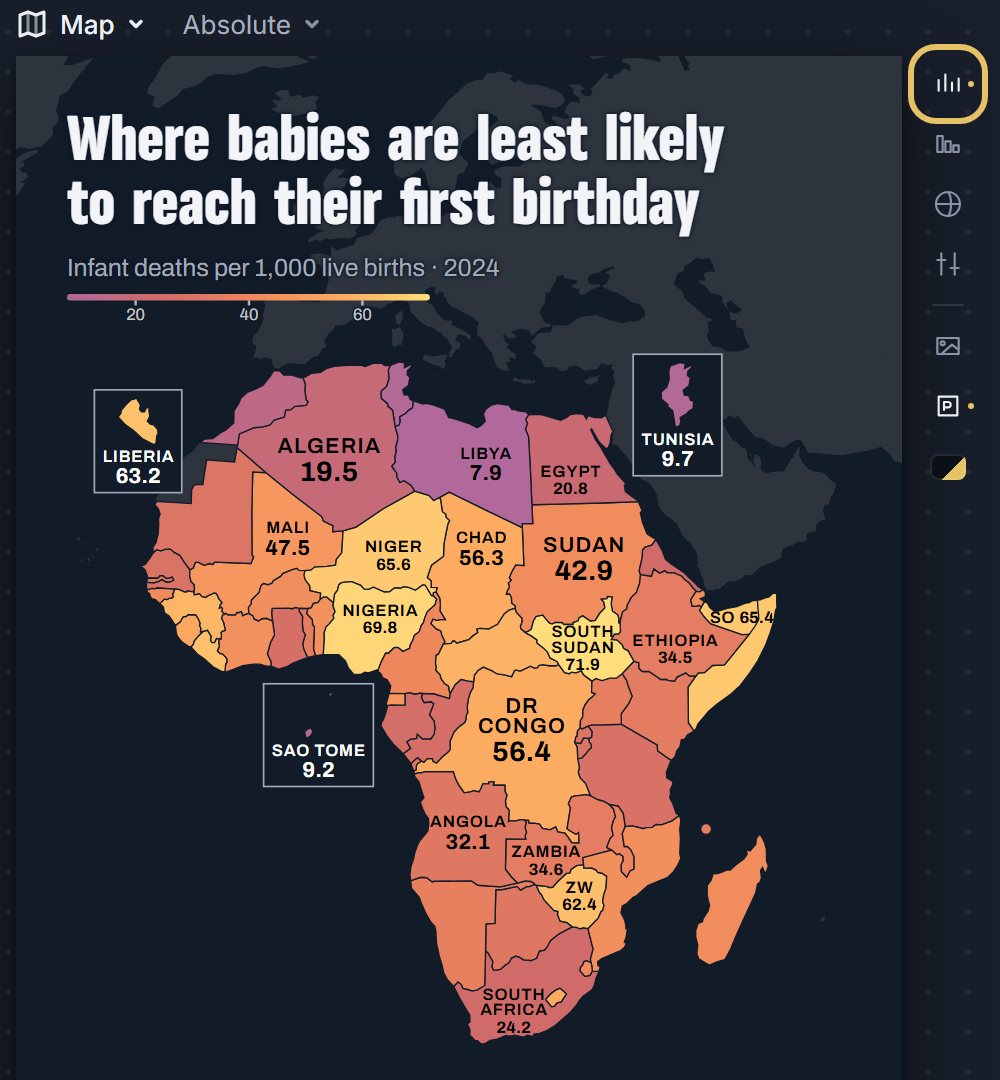
This map shades 54 African countries by infant deaths per 1,000 live births in 2024. It is cropped to Africa, so most countries are big enough to carry a name and a value. Some small countries get a box with their value, and the note names the islands too small to draw.
Map of Africa with 54 countries shaded by infant deaths per 1,000 live births in 2024, brightest where the rate is highest, South Sudan highlighted.
How to make a choropleth map, step by step
Eight steps, from an empty studio to the image file. Each picture shows the control to use, ringed in gold.
Open geolens.eu/create and choose Map, under Places.

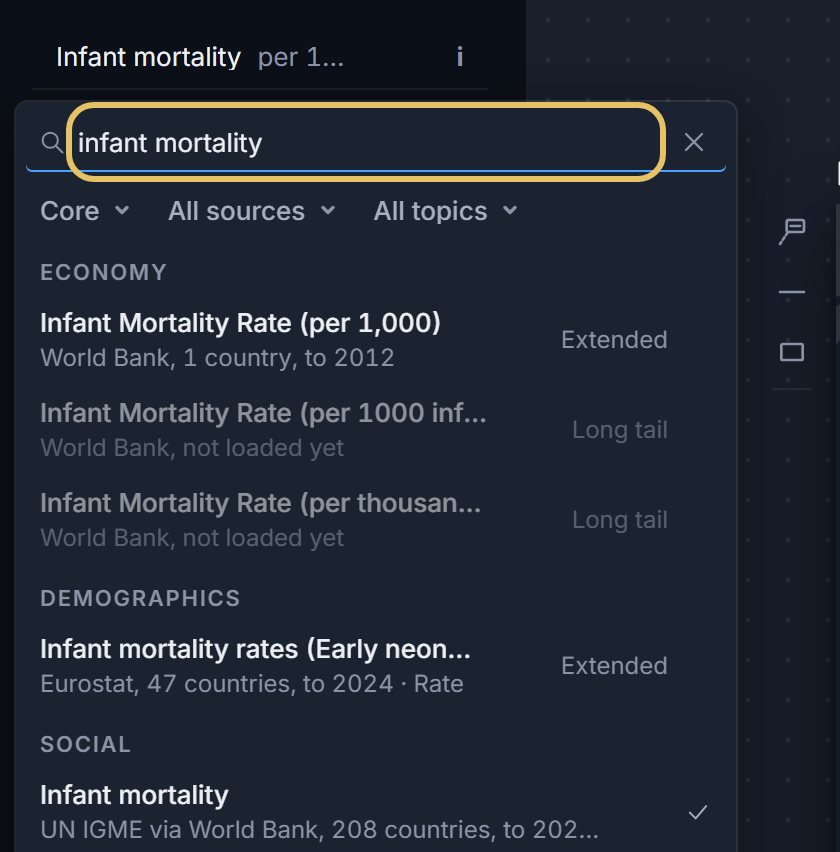
Press the indicator name at the top left and search for your measure, such as infant mortality. A tick marks the one on the map.
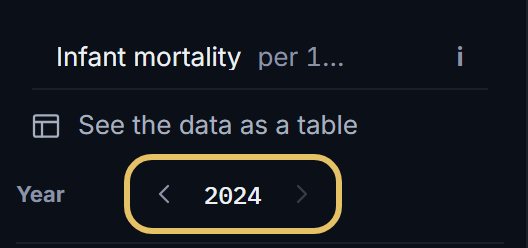
Step the year with the arrows. A map shows one year at a time.
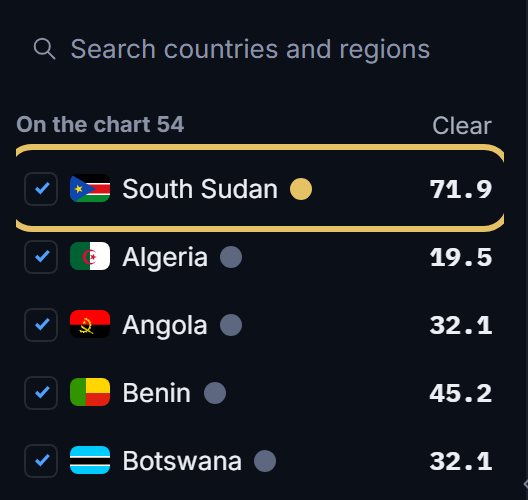
Tick the countries to map. The first in the list wears the gold highlight, here South Sudan.
Press the globe beside the map. Fit picks frames the countries you ticked; World shows the whole map.

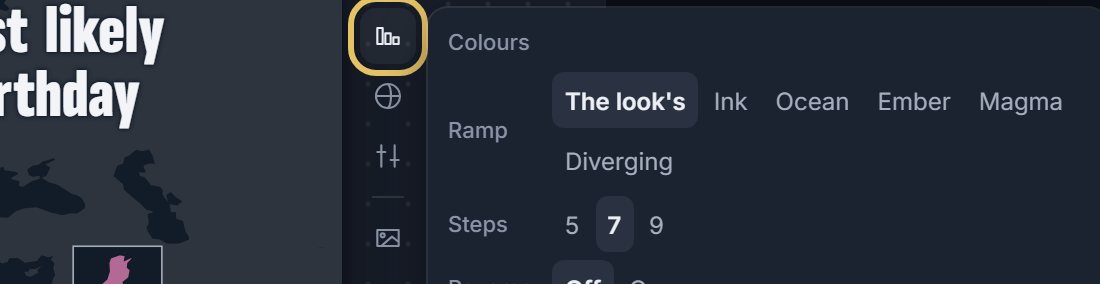
Press Colours to choose the ramp, 5, 7 or 9 steps, and Reverse to flip the ramp end to end.
Leave Values on to print each figure on its country. Press it again to show names only.
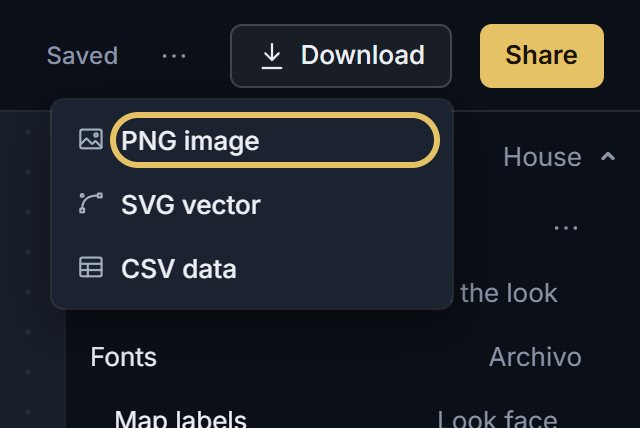
Open Download and choose PNG image.
TipA map shows one year, so if the story is how values changed, use a line chart or a heatmap.
Map a rate, not a total
A total, such as deaths or tonnes of emissions, mostly follows population, so the map only shows where people live. Divide first: per person, per 1,000 births, or as a percentage of GDP.
Large countries take more ink, so a big country with a middling value can outweigh a small one with an extreme value. Name the extremes in the title.
Give the strongest colour to the end your title is about. On this map that is the highest death rates.
When a choropleth map is the wrong chart
A map is weak at exact order. South Sudan at 71.9 per 1,000 and Nigeria at 69.8 are too close to rank by shade, so add a ranking bar chart when the order is the point.