How to make a bump chart of rankings over time
Updated 8 Nov 20262 min read
To make a bump chart, choose Bump in the GeoLens studio, pick an indicator, the countries and the years, then download a PNG. It ranks each country at a few years and joins the ranks with lines, so climbs and falls read at a glance.
What a bump chart shows
Time runs left to right and rank top to bottom, with first place at the top. Each country is one line; where two lines cross, one country overtook the other.
This example ranks 15 countries by energy use per person from 2000 to 2024. Follow the one coloured line; the others are the field it moves through. The United States stays 1st and Russia ends 2nd.
Ranks leave out the size of the gaps, so the big number on the chart puts one real value back.
Bump chart ranking 15 countries by energy use per person from 2000 to 2024, South Korea highlighted.
How to make a bump chart, step by step
Seven steps, from an empty studio to the image file. Each picture shows the control to use, ringed in gold.
Open geolens.eu/create and choose Bump, under Compare countries.
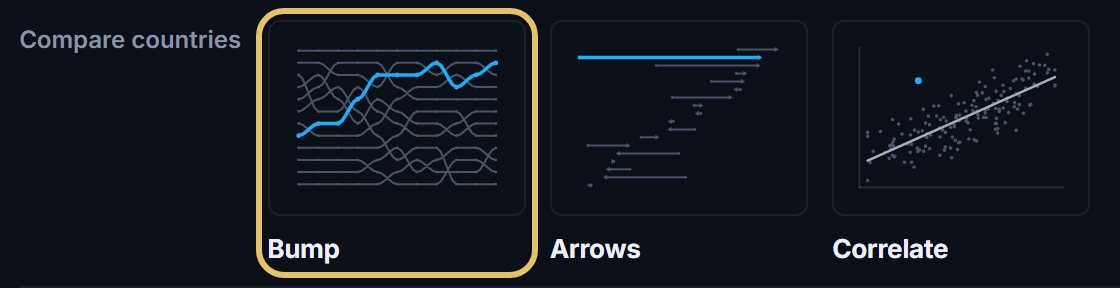
The chart opens straight away as a draft. To rename it, click its name in the bar.

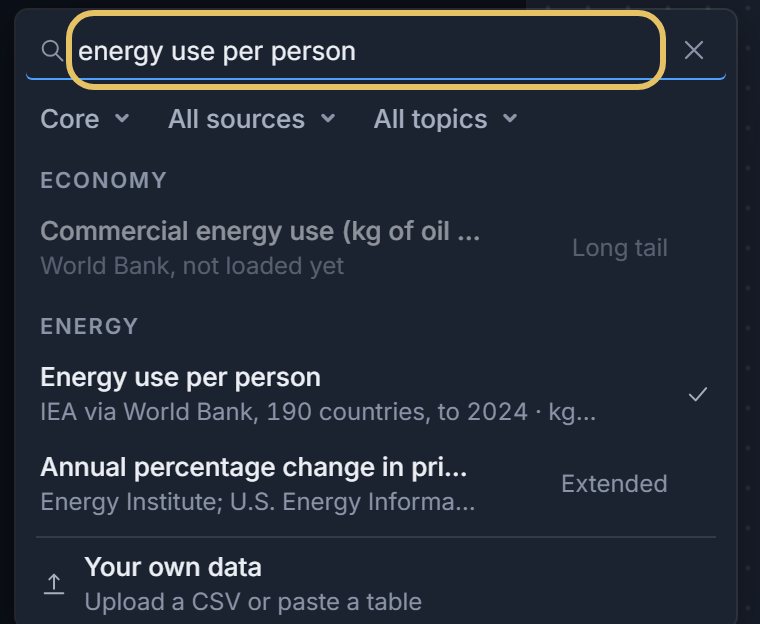
Press the indicator name at the top left and search for your measure, such as energy use per person.
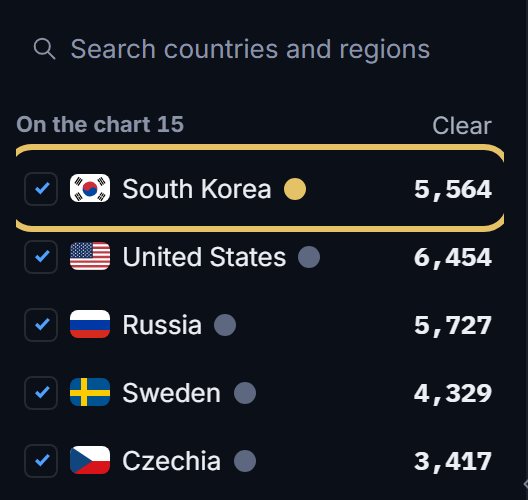
Tick the countries to rank. The first in the list carries the highlight, so drag your story’s country to the top.
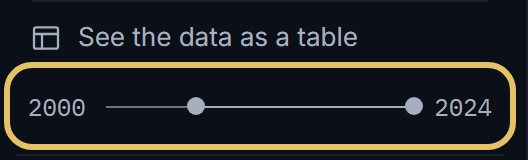
Drag the year range. Its first and last years become the outer columns, and GeoLens fills in up to 8 columns at an even step from the first year.
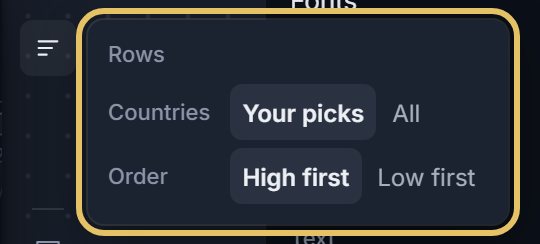
Press Rows beside the chart: Your picks ranks your countries among themselves, All ranks them against every country with data.
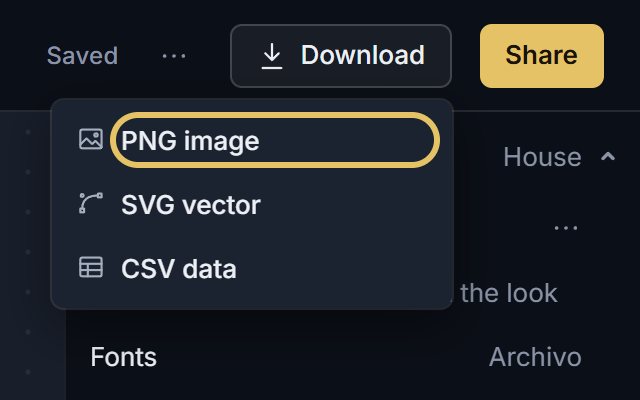
Open Download and choose PNG image. PNG is free; SVG vector comes with PLUS.
TipA country with no value in one of the columns drops off the chart, so check coverage before you choose the years.
Keep a bump chart readable
Highlight one or two countries and let the rest stay quiet.
Ranks depend on the set: add or drop one country and others move. When you quote a rank, give the size of the set, as in 3rd of 15.
Pick the data, or another chart
Prefer values per person, shares or rates. On totals the biggest countries hold the top ranks and the lines barely move.
If only the first and the last year matter, an arrow chart shows each move with less ink. If the size of the gaps matters, use a line chart.
Any chart you made can become a bump: choose Bump in the shape menu above it. To start from the example above, press Edit this chart under it.