How to chart your own data from a CSV or Google Sheet
Updated 8 Nov 20261 min read
In the studio, open Start with data, then paste a table, upload a CSV or TSV, or link a Google Sheet. Check how GeoLens reads it, add your source line and unit, say whether the numbers are counts or rates, and press Read this table. Own data files come with PLUS and PRO.
What shape your table needs
Countries down the first column and years across, or a Year column. One indicator per file. Files can hold up to 50,000 rows and 5 MB, and they stay private to you.
The example below uses invented numbers to show the shape.
How to chart your own data, step by step
Six steps on the Start with data tab of geolens.eu/create. Each picture shows the control to use, ringed in gold.
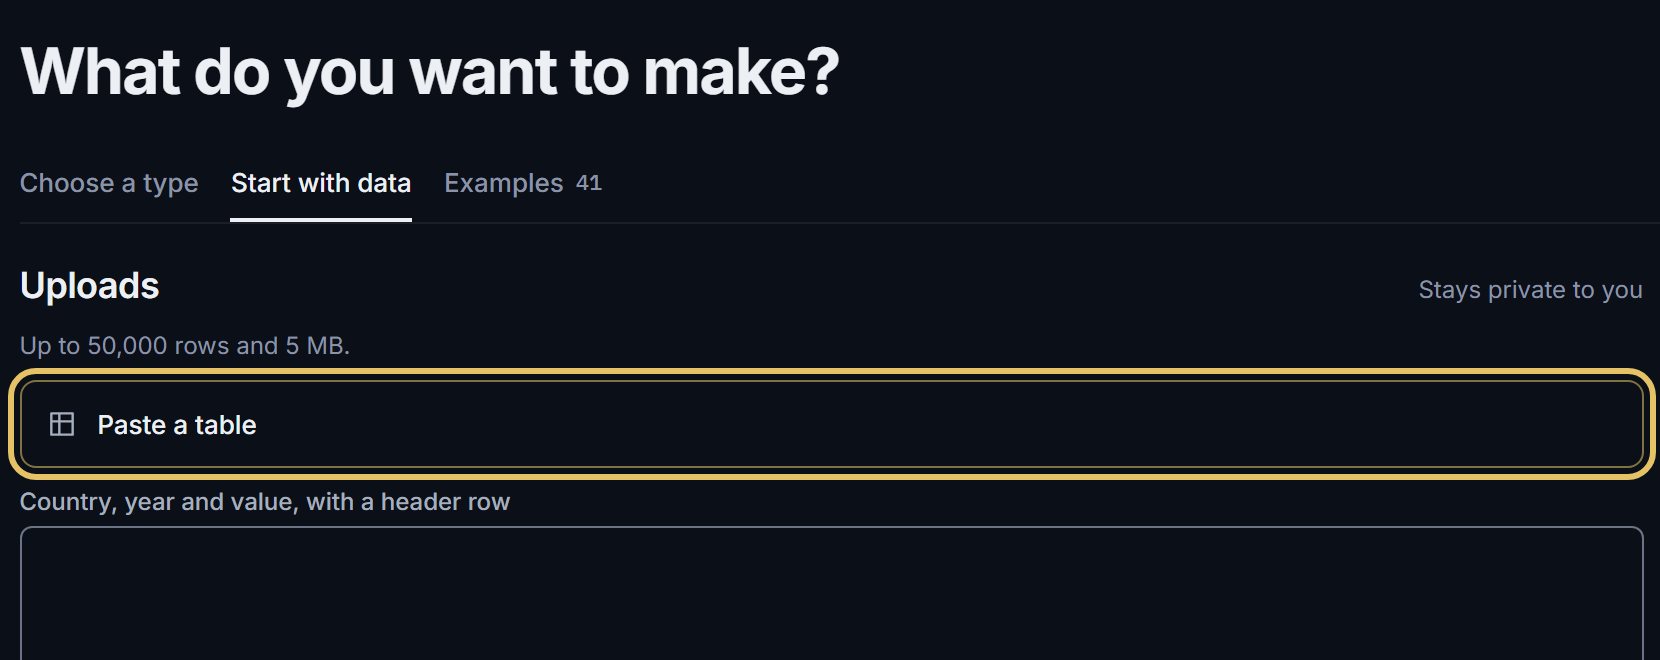
Open Start with data and choose how to bring the table in: Paste a table, Upload a CSV or TSV, or Link a Google Sheet.
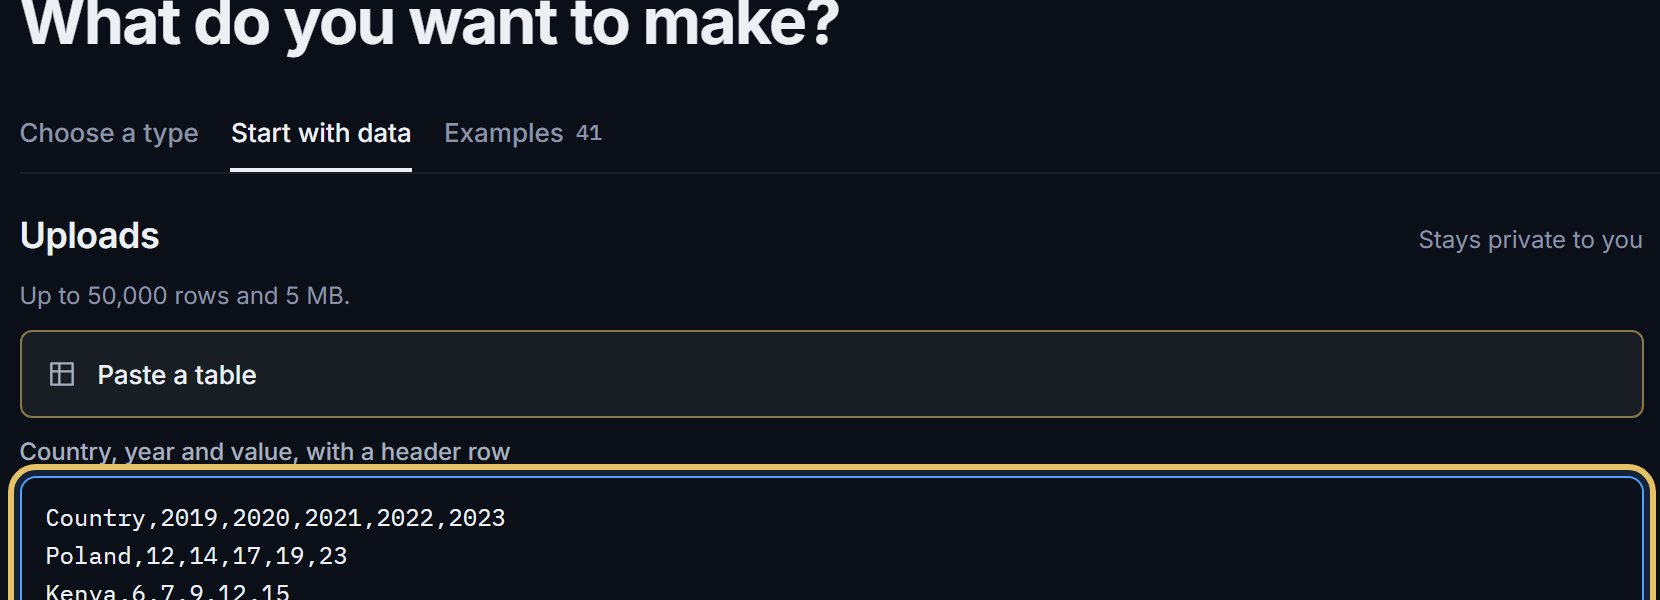
Paste the table, header row first. Here it holds a country column and five years.
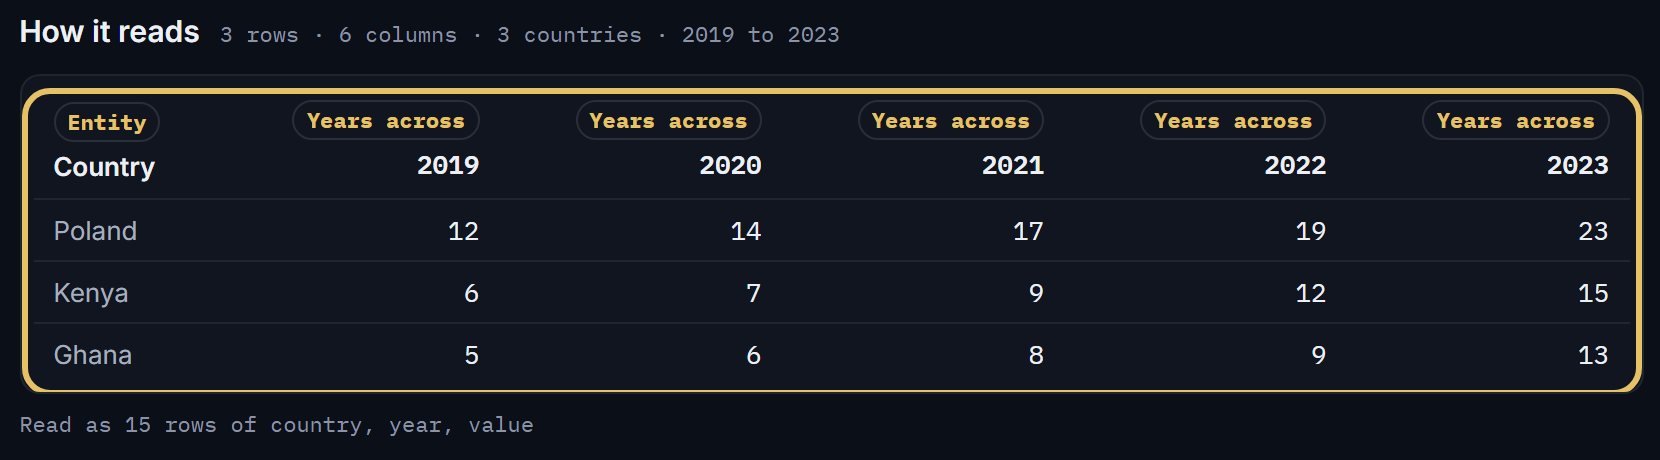
Under How it reads, check that GeoLens took each column for what it is. A wide table is read as rows of country, year and value.
Fill in the source line, which prints on every export, a name for the dataset and the unit.

Say whether the numbers are counts or rates. A count can be summed; a percentage or an index cannot.

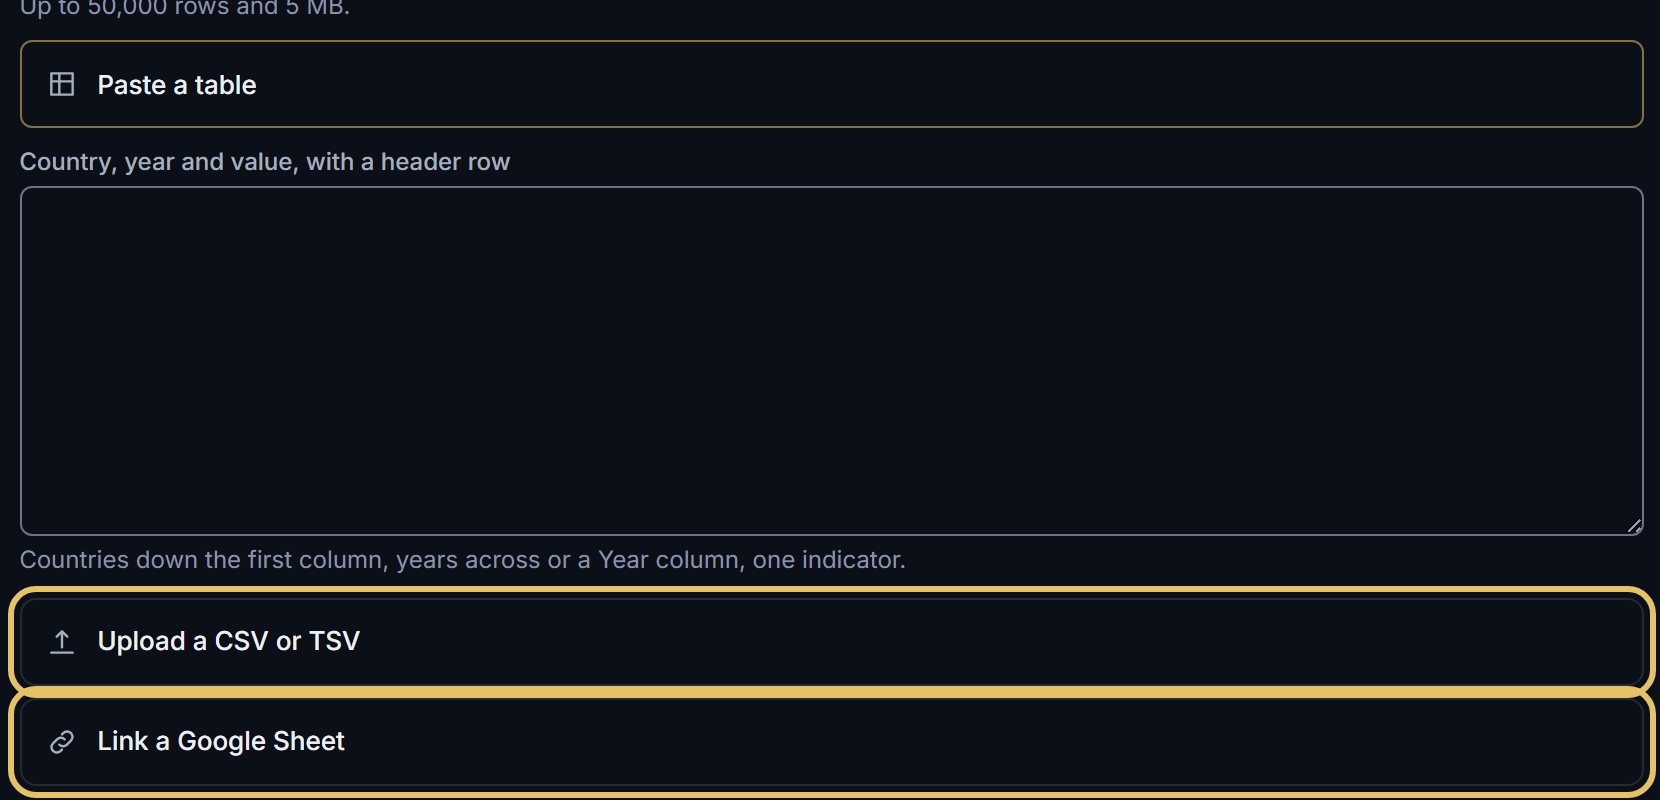
A file or a Google Sheet works the same way: choose that door and the table appears under How it reads.
TipWrite the source line before you chart. A chart without a source is not ready to post.
Why counts and rates matter
A count is a total you can add up, such as drones, tonnes or people: a running total means something. A rate is a percentage, a price or an index: adding rates up would be nonsense. The studio keeps your answer with the dataset. To compare countries of different sizes, divide counts by population first.
When some rows do not read
Rows with a country GeoLens cannot match or a value it cannot read are listed with the reason. Map the names it offers, fix the file, or continue with the rows that read.