Which chart to use for country data
Updated 8 Nov 20262 min read
Pick the chart from your question: a line for change over time, bars for one year, a bump chart for rank and a map for where. In GeoLens you switch the same data between types from the menu above the chart.
One dataset, several questions
This heatmap holds the 27 EU members over 36 years: one row per country, one column per year, colour for the value. It shows the whole pattern at once, but no exact values.
The same data answers other questions as a line, a bump chart or a map. The steps below switch between them.
Heatmap of annual population growth in the 27 EU member states, one row per country, 1990 to 2025, Bulgaria highlighted.
How to pick and switch the chart type, step by step
Seven steps, from the type catalogue to the image file. Each picture shows the control to use, ringed in gold.
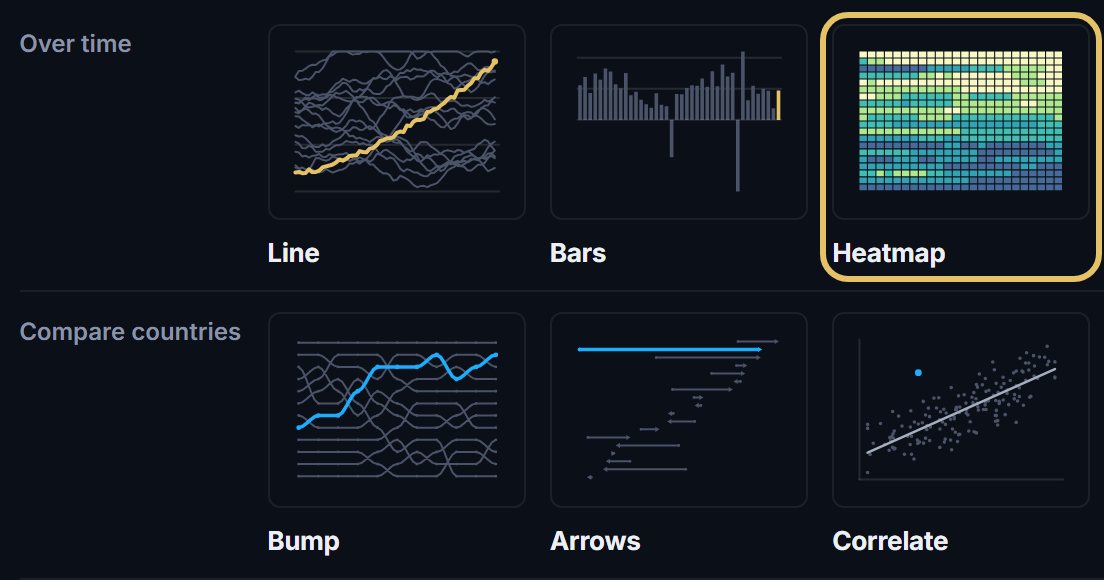
Open geolens.eu/create and choose a type. The types sit in four groups: Over time, Compare countries, Places and For social.
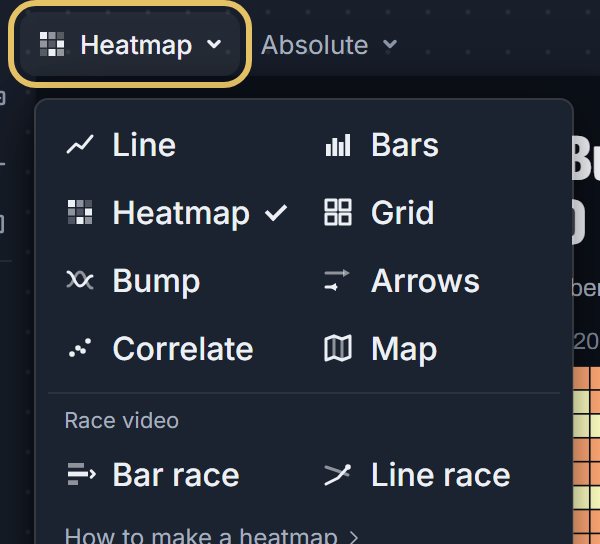
In the studio, press the type name above the chart. The menu lists every chart type, with the two race videos at the bottom.
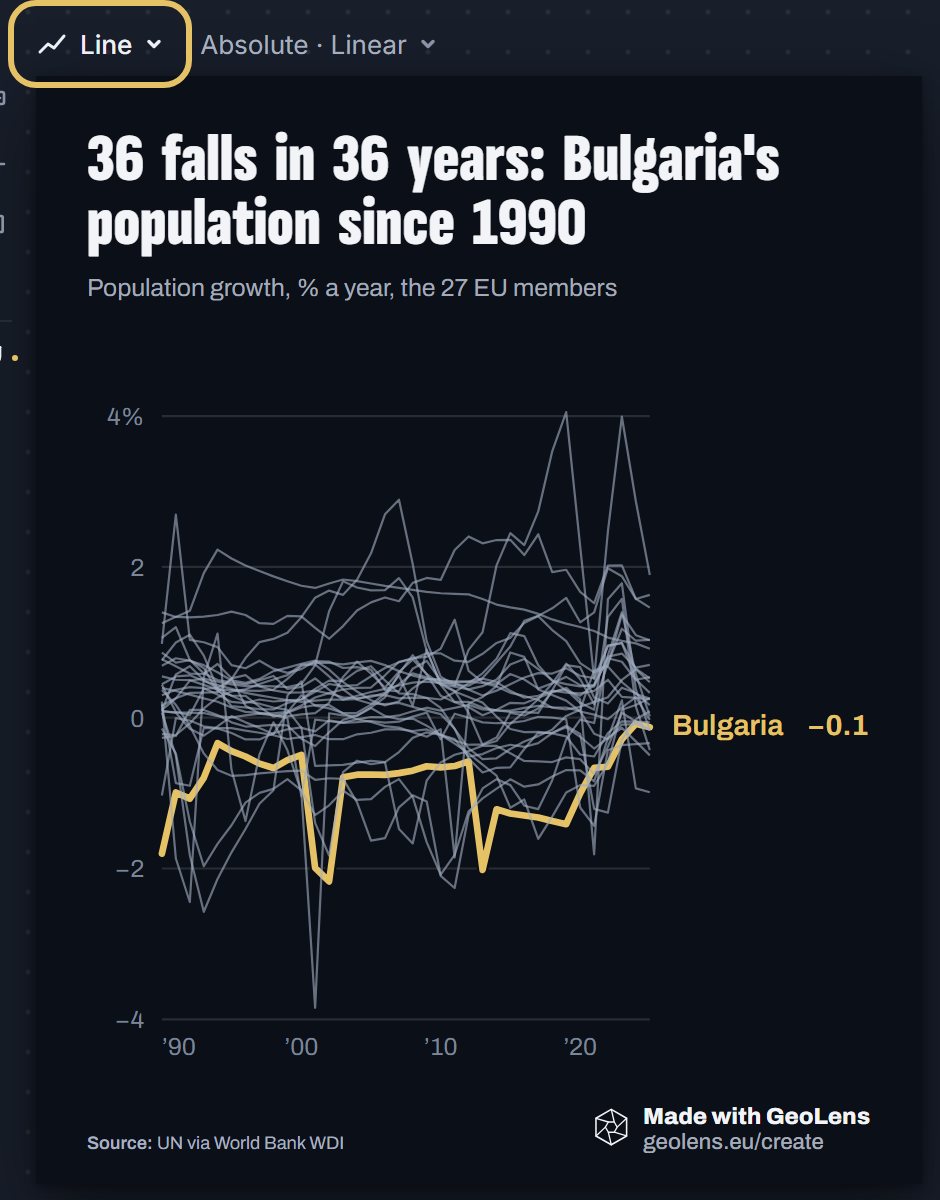
Choose Line to follow change over time. Your countries, years and title stay. With 27 lines, only the highlighted country stands out.
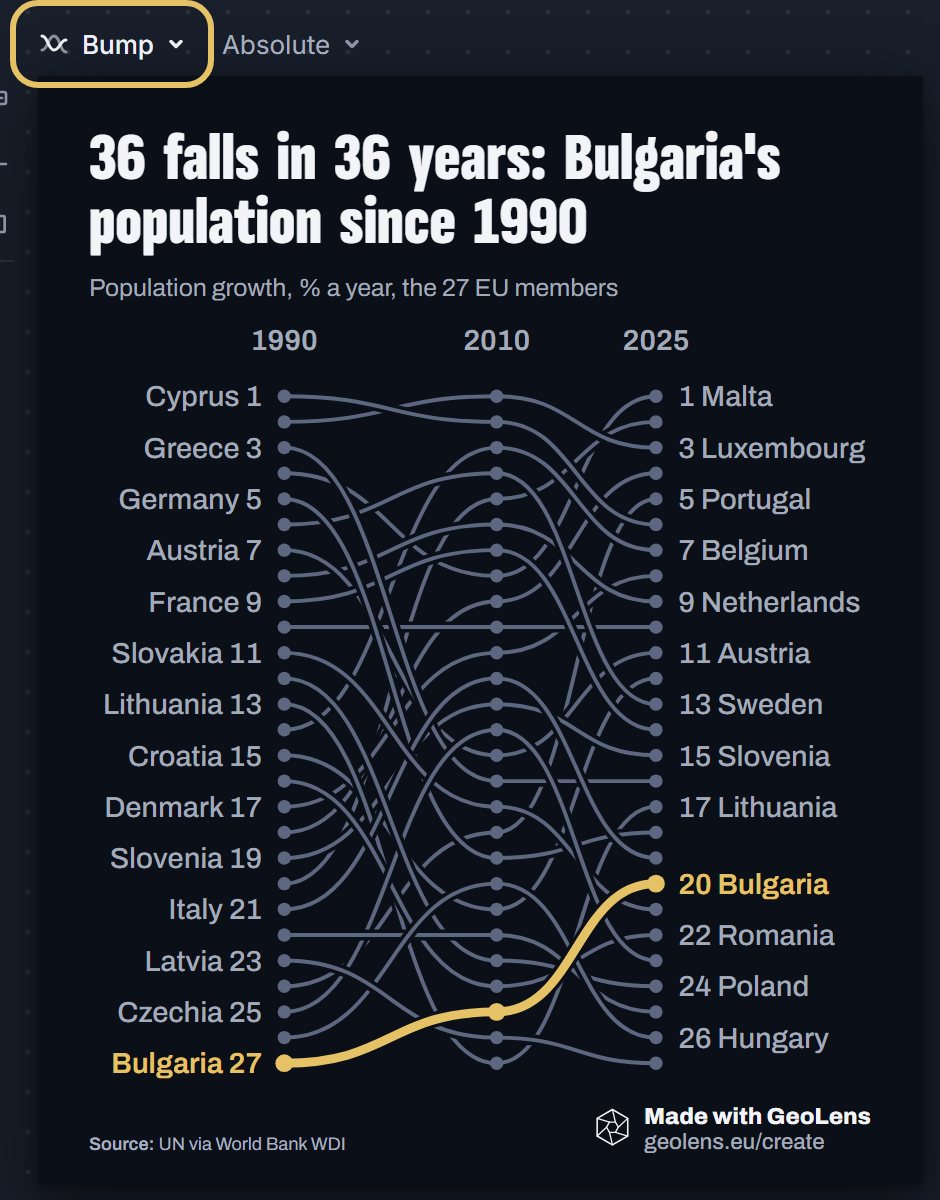
Choose Bump when the order matters more than the values. It ranks the countries in each year and draws each climb or fall as a line.
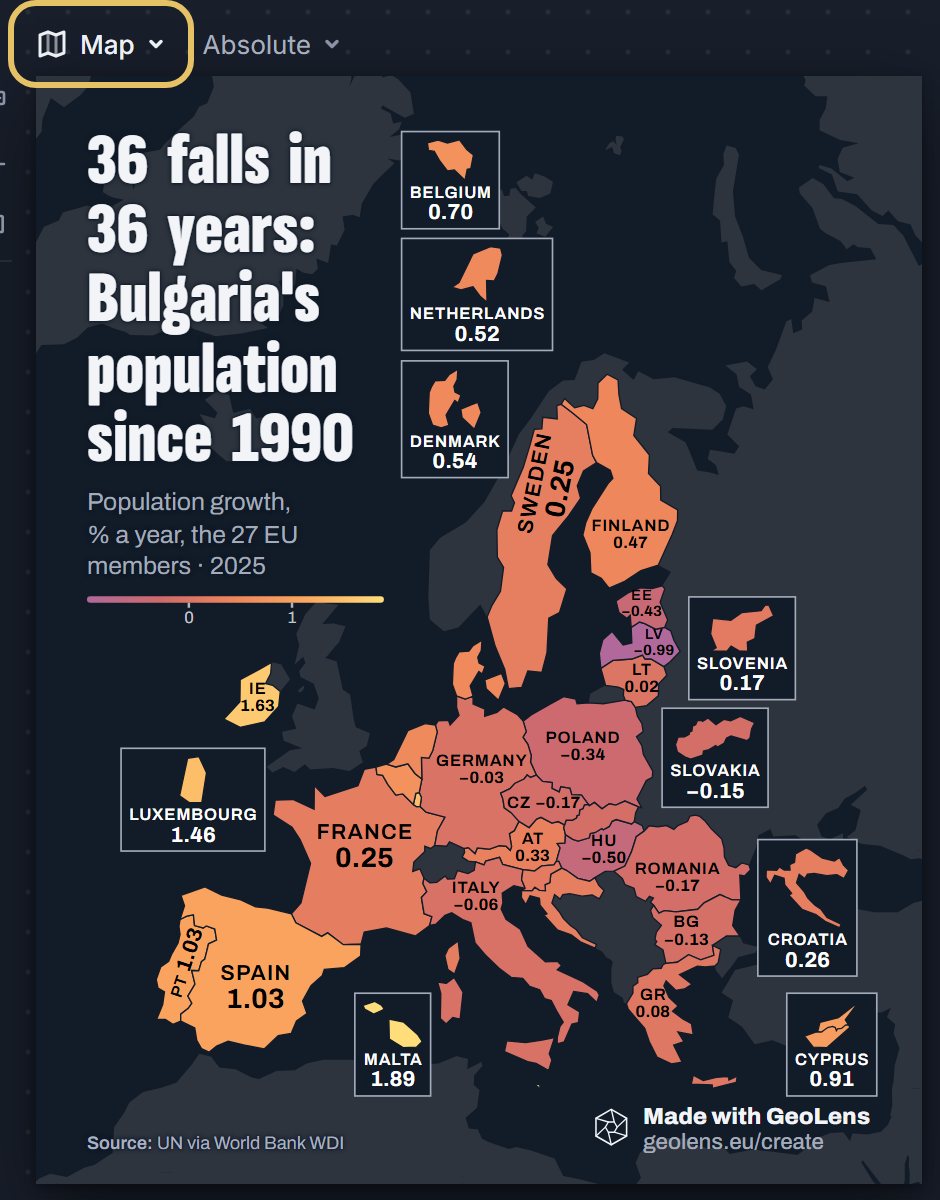
Choose Map to show where. A map draws one year, and the subtitle names it.
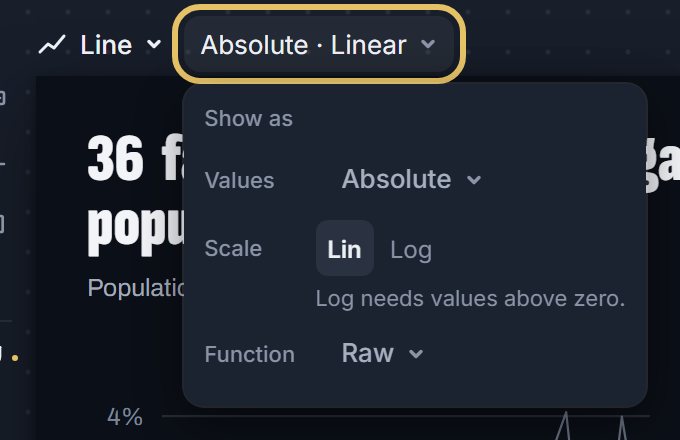
Press Show as to change the values: indexed to 100, per capita or share where the data allows. Lines take a log scale when every value is above zero.
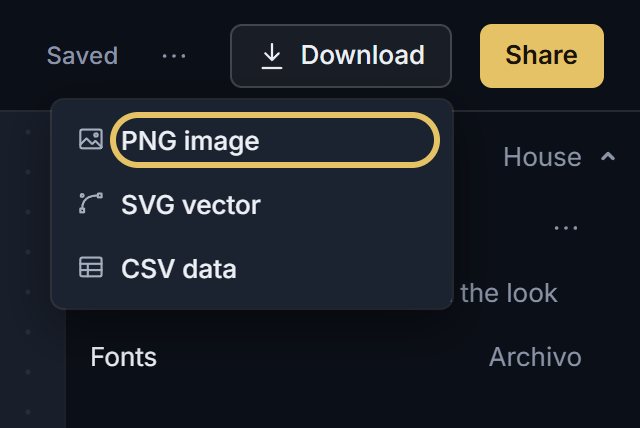
Open Download and choose PNG image, free with an account. SVG vector comes with PLUS.
TipA scatter plot shows two indicators going together, not one causing the other.
Which chart answers which question
Write your question as one sentence before you open the menu. That sentence usually names the chart.
The table
| Your question | Type in GeoLens | Pick something else when |
|---|---|---|
| How did it change over the years? | Line | The countries differ hugely in size: index them or show per capita |
| Who is highest in one year? | Bars | The story is a trend across many years |
| What is the pattern across many countries and years? | Heatmap | Only a few countries are on it: lines read faster |
| Does each country have its own shape over time? | Small multiples | Readers must compare exact levels between countries |
| How did the order change, year by year? | Bump | Countries swap places every year and the lines cross constantly |
| Who moved most between two years? | Dumbbell | What happened in between matters |
| Do two indicators go together? | Scatter | Either indicator has large gaps in its data |
| Where is it high or low? | Map | The region has many small countries that vanish at post size |
| Who led, and when, as a video? | Bar race | The leader never changes: a still chart says it faster |
| How did a few countries unfold, as a video? | Line race | It will mostly be seen as a still image |
When to pick something else
A bump chart keeps the same distance between ranks, however close the values are. When a gap matters, say it in the subtitle.
A map misleads with totals, because large countries take more ink. Map rates and shares instead.
Some types draw only a few countries. The studio tells you when it leaves some out.
Bump chart ranking 15 countries by energy use per person in each year from 2000 to 2024, South Korea highlighted.