How to add insights to a chart: gap, crossovers and the world
Updated 9 Nov 20261 min read
To add an insight to a chart in GeoLens, open Add on the right. Under Insights, Gap shades the space between two lines and Crossovers marks the year one passes the other. Under Overlays, World sets your countries against every country that reports.
What an insight adds
GeoLens reads the lines on your chart and offers what it finds: how a gap changed, the year one country passed another, and where your country stands in the world.
Each insight draws on the chart in one press, so you check it against the data instead of drawing it by hand.
How to add an insight, step by step
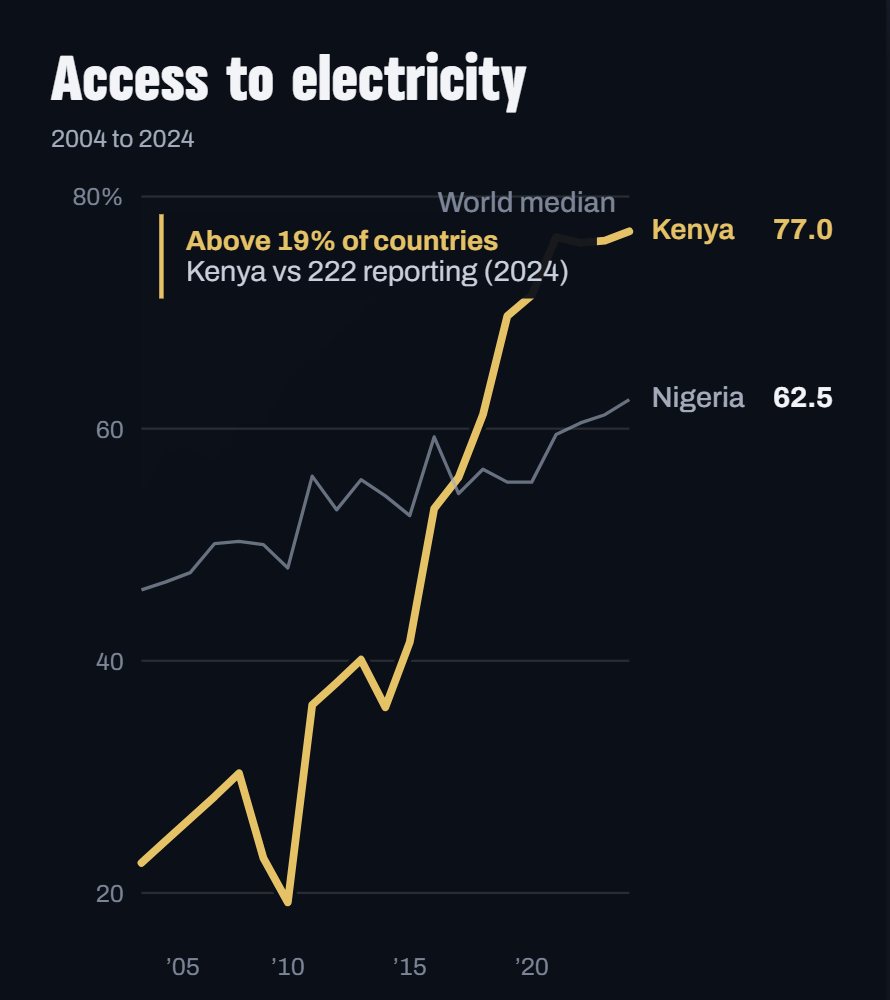
Six steps on a line chart of the share of people with electricity in Kenya and Nigeria, 2004 to 2024. Each picture shows the control to use, ringed in gold.
Open Add on the right. Under Insights each button names what it found, such as Gap 38% closed or Crossovers 2017.
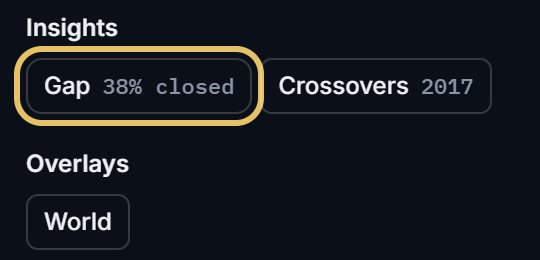
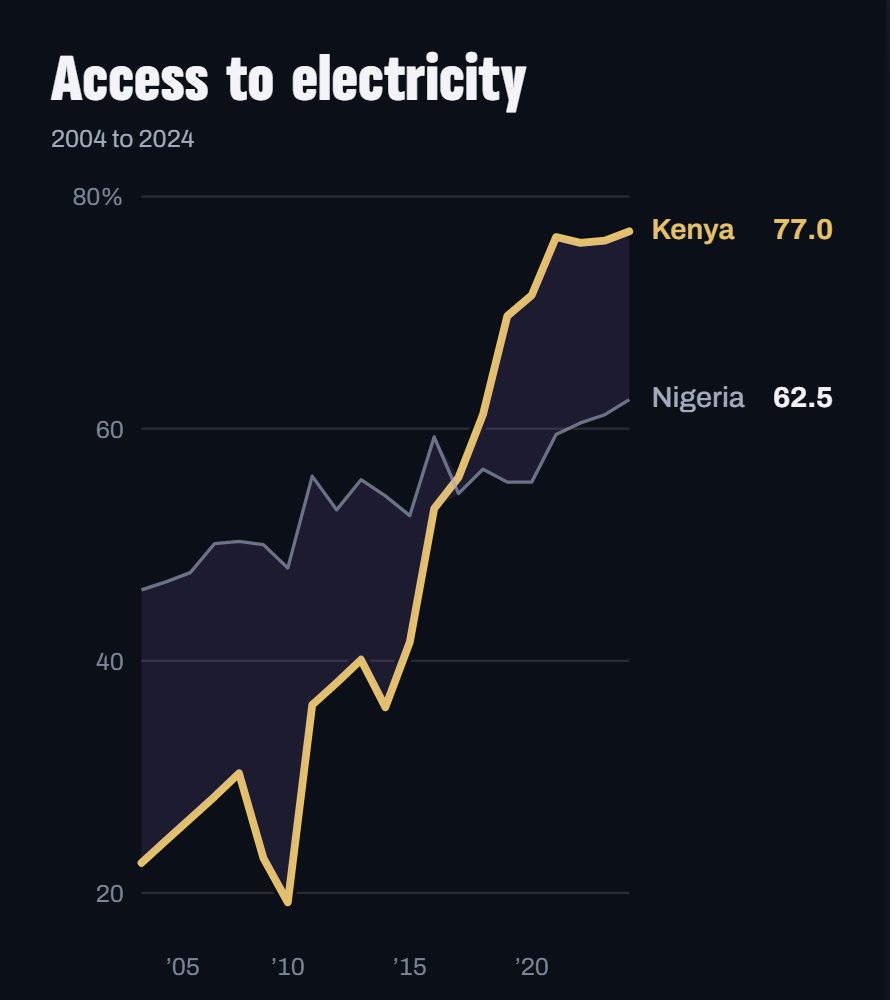
Press Gap to shade the space between the two lines.
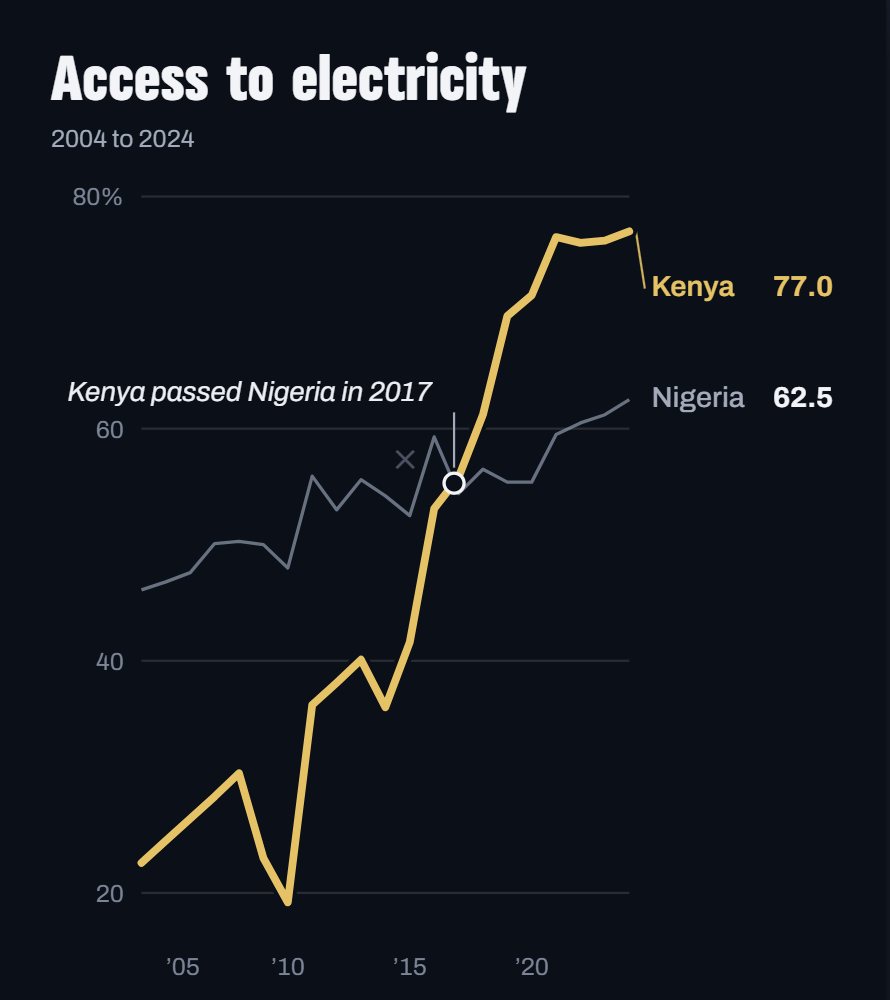
Press Crossovers to ring the year one line passes the other, with a label: Kenya passed Nigeria in 2017.
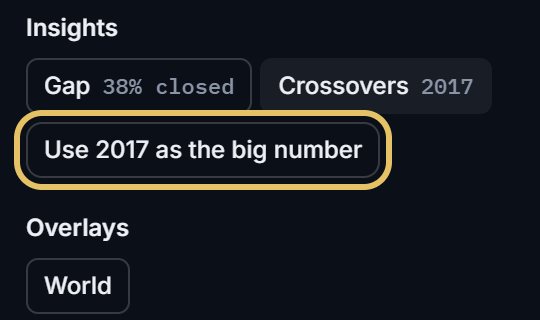
Once an insight is on, a button offers it as the big number at the top of the chart, here Use 2017 as the big number.
Under Overlays, press World. It draws the world median and says where your highlighted country stands: Kenya is above 19% of the 222 countries reporting in 2024.
Each insight joins Layers, where the eye hides it and the bin removes it.
TipKeep the insight your title talks about and remove the others.
Read an insight before you keep it
A crossover in a noisy series can be a blip: check that the line stays passed for a few years before you put it in the title.
The world note counts the countries with a value in the last year, so it can change when new data arrives.