How to smooth a line or chart the yearly change
Updated 9 Nov 20261 min read
To smooth a line chart in GeoLens, open Show as above the chart and set Function to Moving average, then pick a window of 3, 5, 10 or 20 years. To chart how much each year moved, set Function to % change (YoY).
Two ways to read the same series
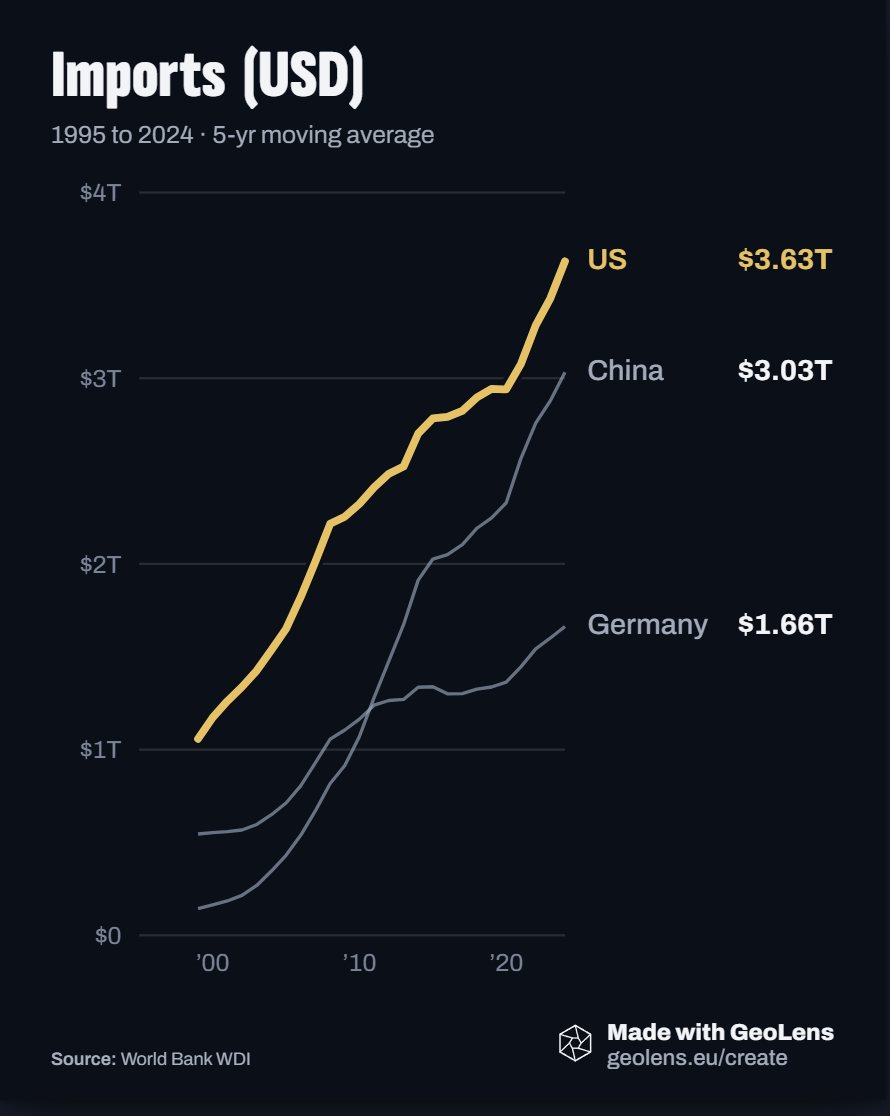
Raw values jump from year to year. A moving average replaces each point with the mean of the years before it, so the trend shows and single-year jolts fade.
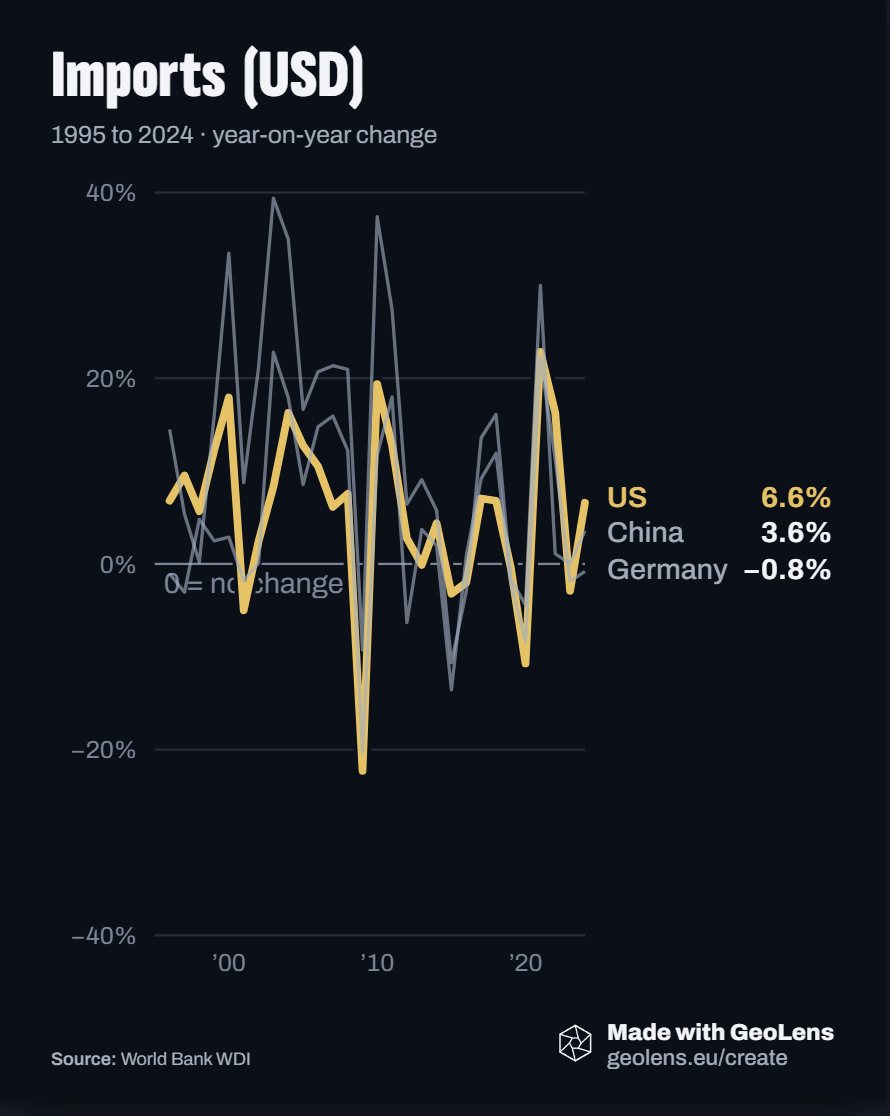
% change does the opposite: it charts how much each year differs from the one before, so the jolts are the story. US imports fell 22 percent in 2009, the deepest drop of the three countries here.
How to change the function, step by step
Five steps on a line chart of imports of goods and services by the US, China and Germany, 1995 to 2024. Each picture shows the control to use, ringed in gold.
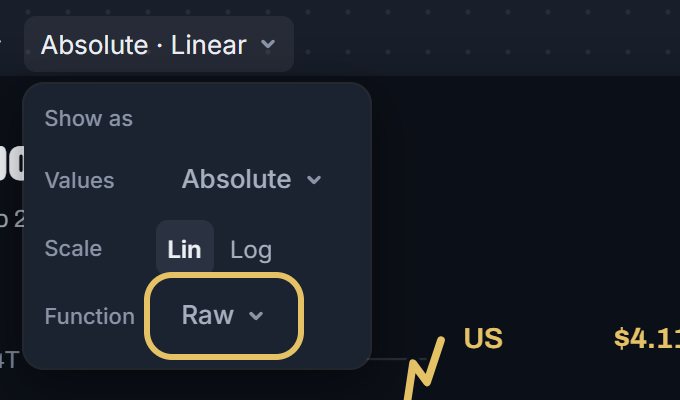
Open Show as above the chart and press Function. The menu offers Raw, Moving average and % change (YoY).
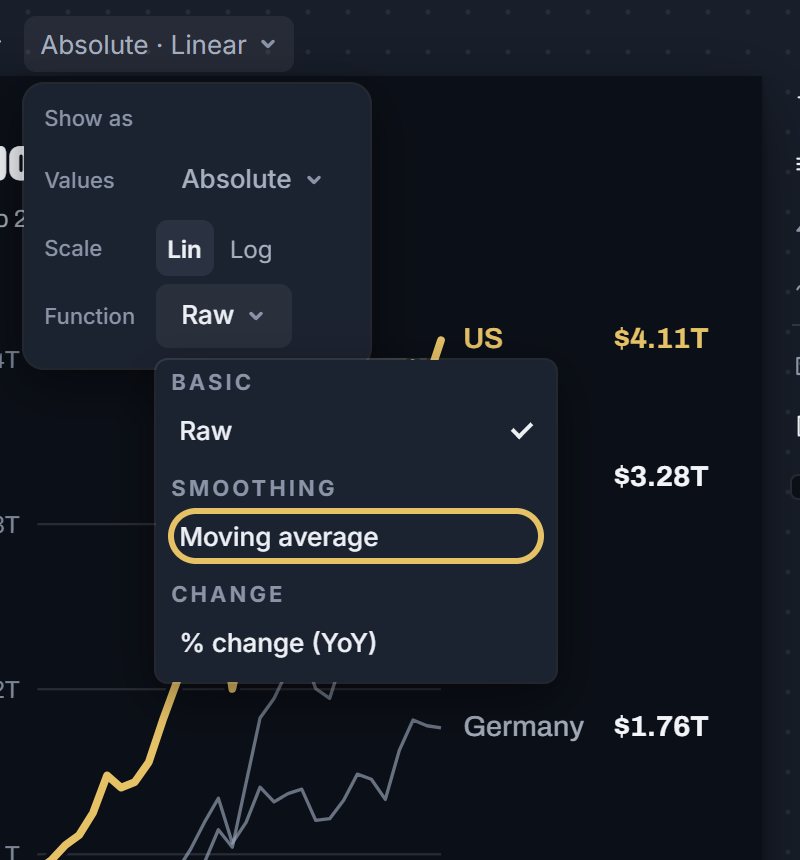
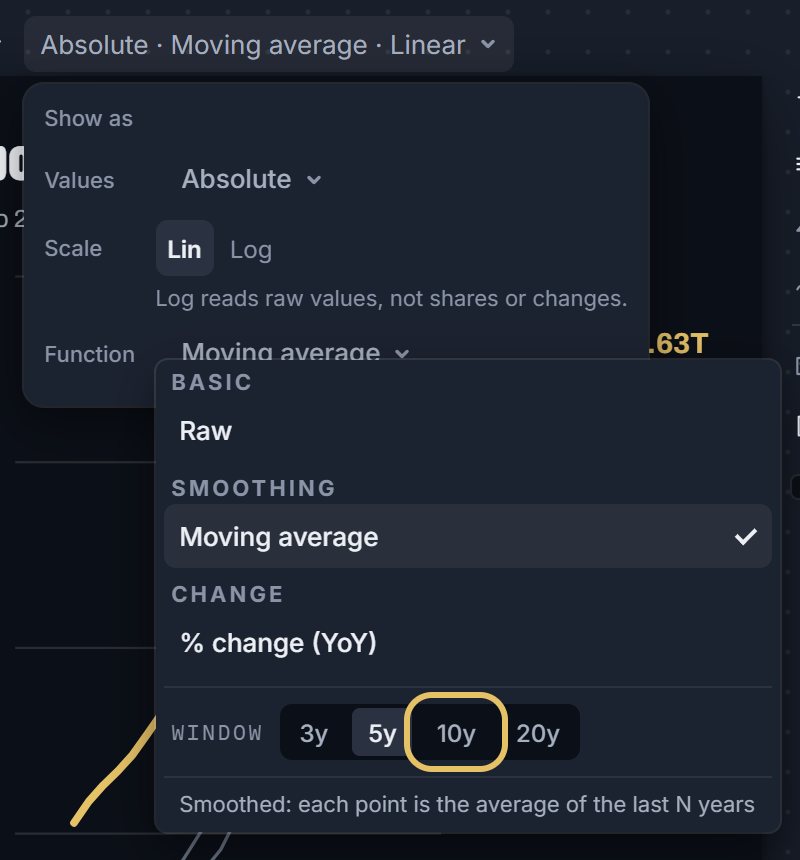
Choose Moving average, then the window under it: 3, 5, 10 or 20 years. A longer window gives a calmer line.
The line under the title now says 5-yr moving average. The first years drop off, because a 5-year average needs the four years before it.
Choose % change (YoY) to chart the change from each year to the next. A dashed rule marks 0, no change, and the 2009 crash shows as the deepest dip.
To go back to the values as published, choose Raw.
TipSay it in the title when the line is smoothed, so nobody reads an average as a single year.
When to use which
Use a moving average when the trend matters and the year-to-year noise hides it, such as yearly rainfall or migration. Use % change when the shocks matter, such as a crisis or a boom.
A log scale reads raw values, not shares or changes, so keep Lin for % change.