How to cite a data source on a chart
Updated 8 Nov 20262 min read
Put the source on the chart itself, in one line under the plot: who produced the numbers and who republished them. GeoLens writes that line from the indicator's record; add a credit and a note under Design, Source and credit.
What a good source line looks like
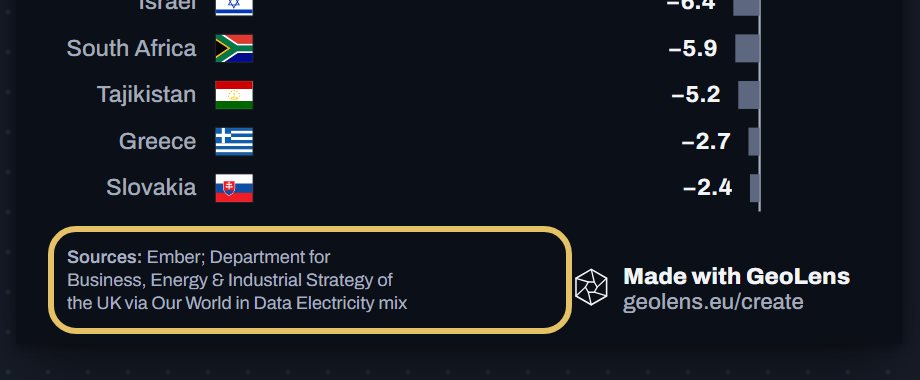
This chart credits Ember and the UK energy department first, then Our World in Data, which republishes their series. The year sits in the line under the title, so the image carries everything a reader needs to check it.
A reader who doubts a number finds the producer in seconds, without leaving the image or searching the web.
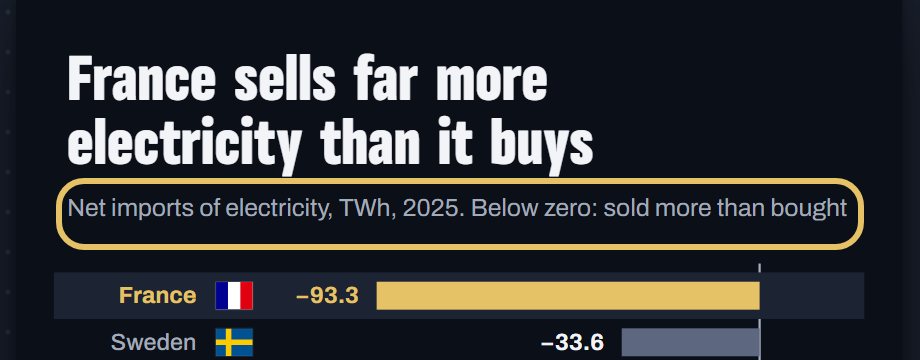
Ranking of net electricity imports in 2025, with France highlighted as the biggest net seller.
How to cite the source, step by step
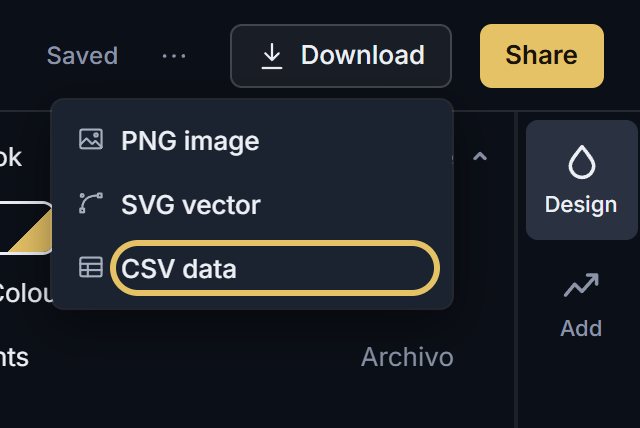
Five steps on a chart of net electricity imports. Each picture shows the control to use, ringed in gold.
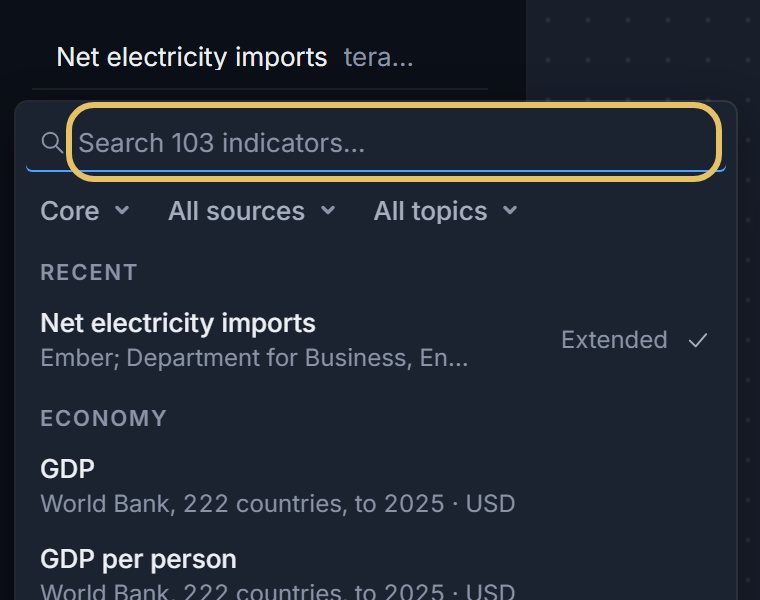
Press the indicator name at the top left and search. Each row names who produced the data, so you know the source before you pick.
Find the source line under the chart. GeoLens writes it from the indicator's record: the producer first, then who republishes it.
State the period in the line under the title, here 2025, so the source and the year sit on one image.
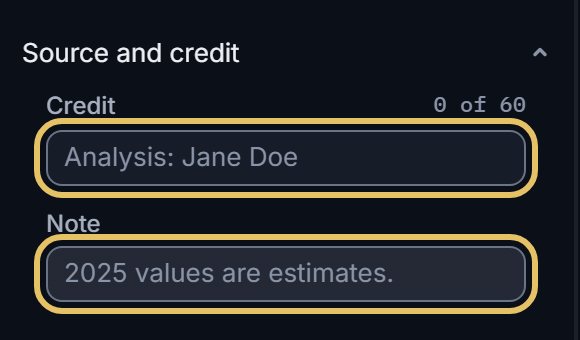
In Design, open Source and credit. Credit takes your name or team, Note takes a caveat such as estimated values.
Open Download. The PNG carries the source line, and CSV data starts with the indicator, unit, source and period.
TipName the producer of the numbers, not the website or the app where you found them.
What a source line should say
Add the dataset when one producer publishes several, such as World Bank WDI, so readers find the exact table.
Keep it to one line. Put caveats in a note, not in the source.
With two datasets, name both: a per person chart in GeoLens credits the emissions source and the population source on one line.
When the data is your own
When you upload your own file, fill in the field Source line, printed on every export.
Left empty, the chart says Own data, unverified, so readers know nobody has checked it. Fill it in even for a quick draft: charts travel further than you plan.
If you cleaned or combined the data yourself, say so, for example: own analysis of Ember data.