Chart looks: House, Paper, Editorial and Feature
Updated 8 Nov 20261 min read
A look is the whole skin of a chart: ground, ink, accent and type. GeoLens has four: House and Paper on every plan, Editorial and Feature on PLUS and PRO. Pick one in the Look row of the Design tab and the chart redraws at once.
What a look changes
A look sets colours and type only. The chart type, the data and your words stay as they are, so you can try all four on the same chart and keep the one that reads best where you post it.
How to change the look, step by step
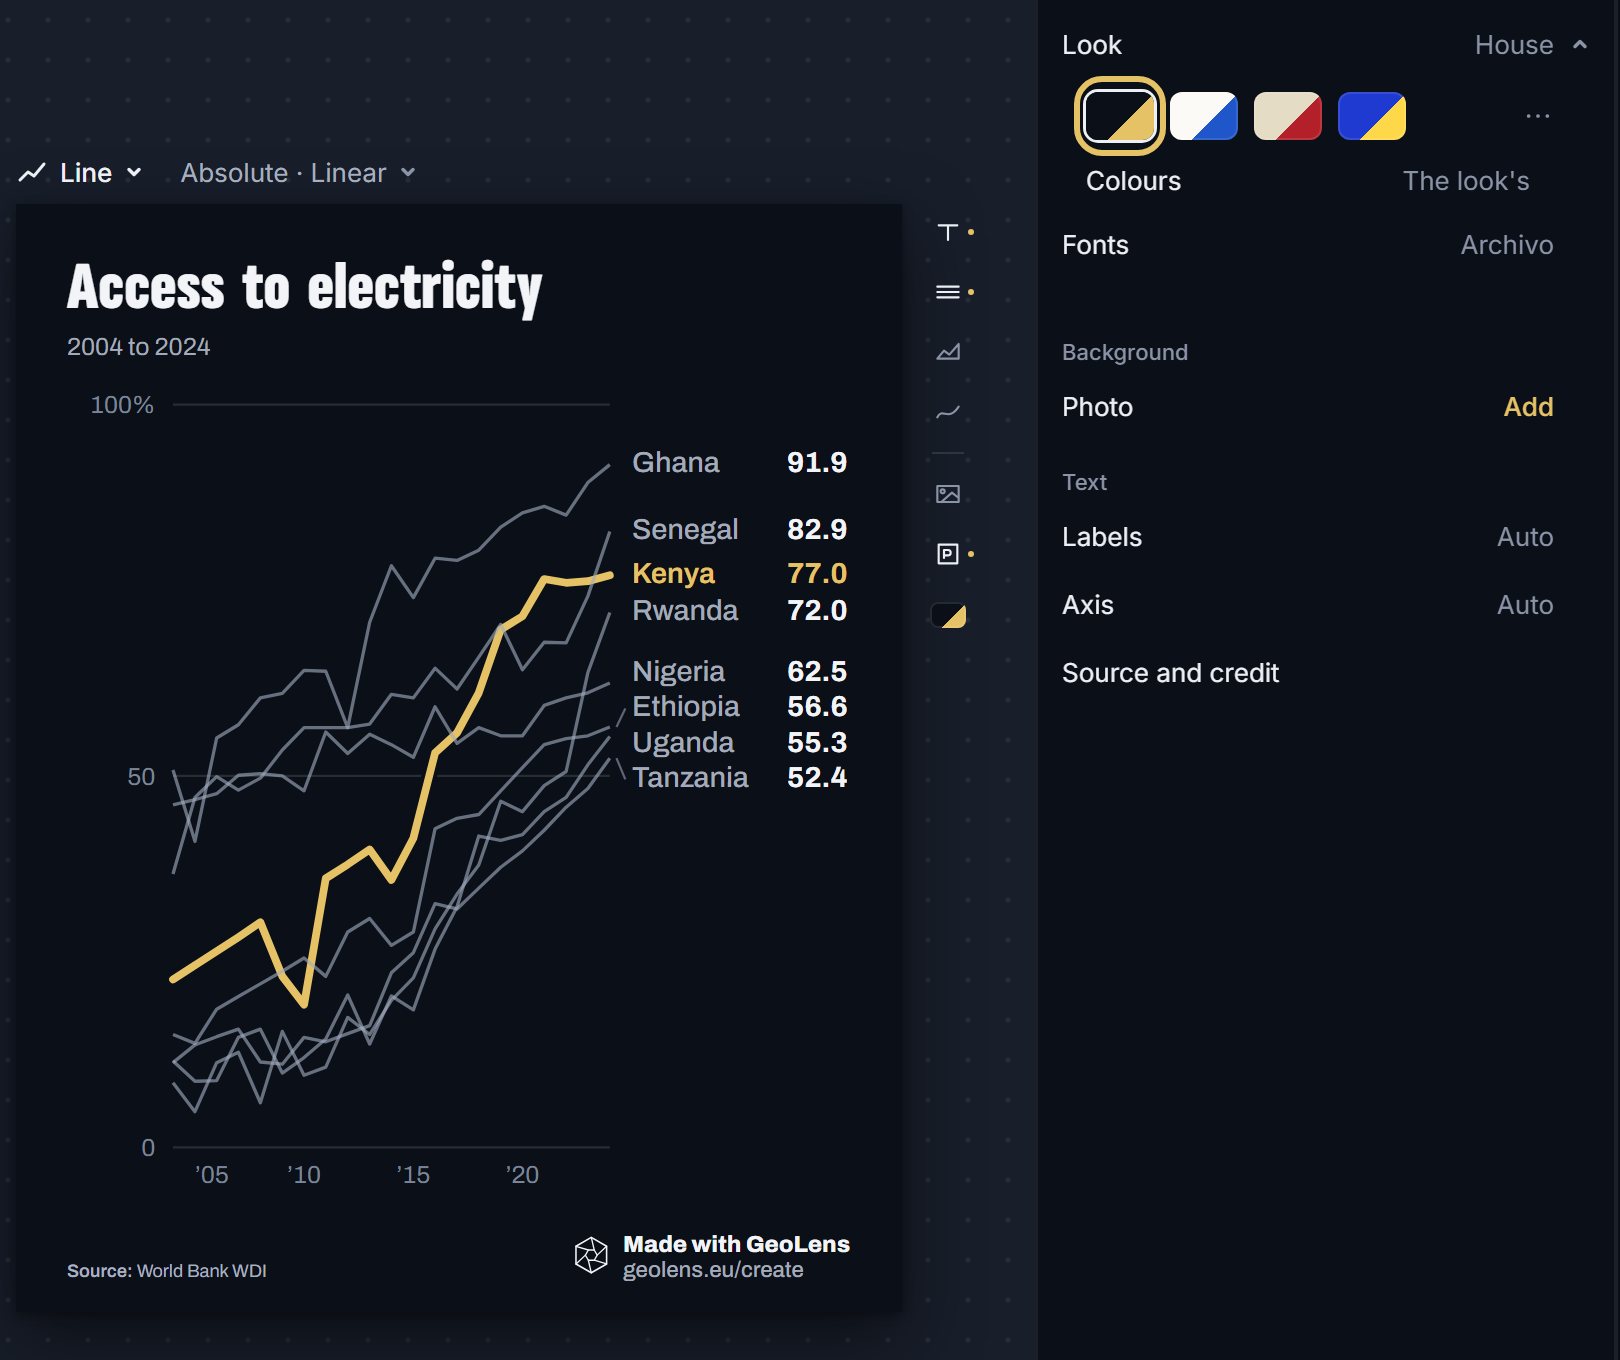
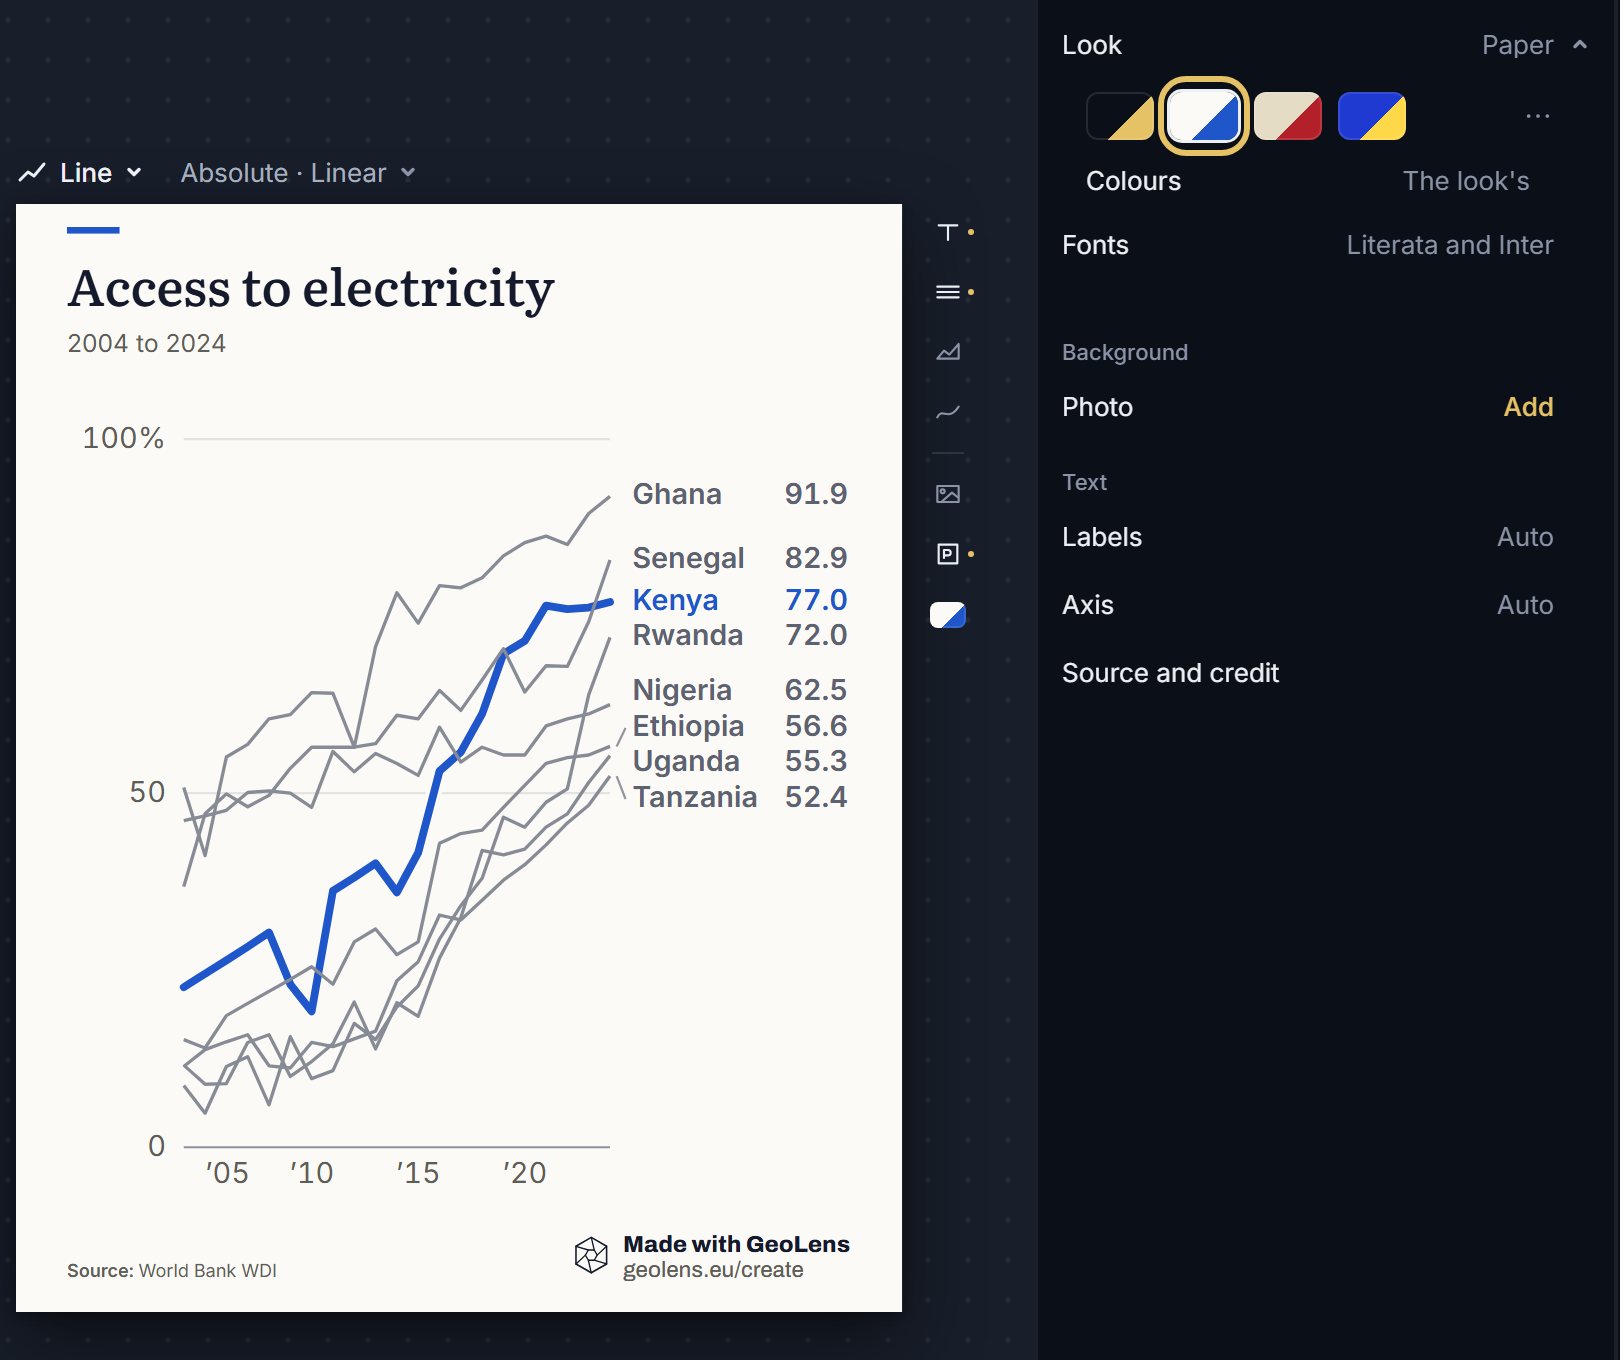
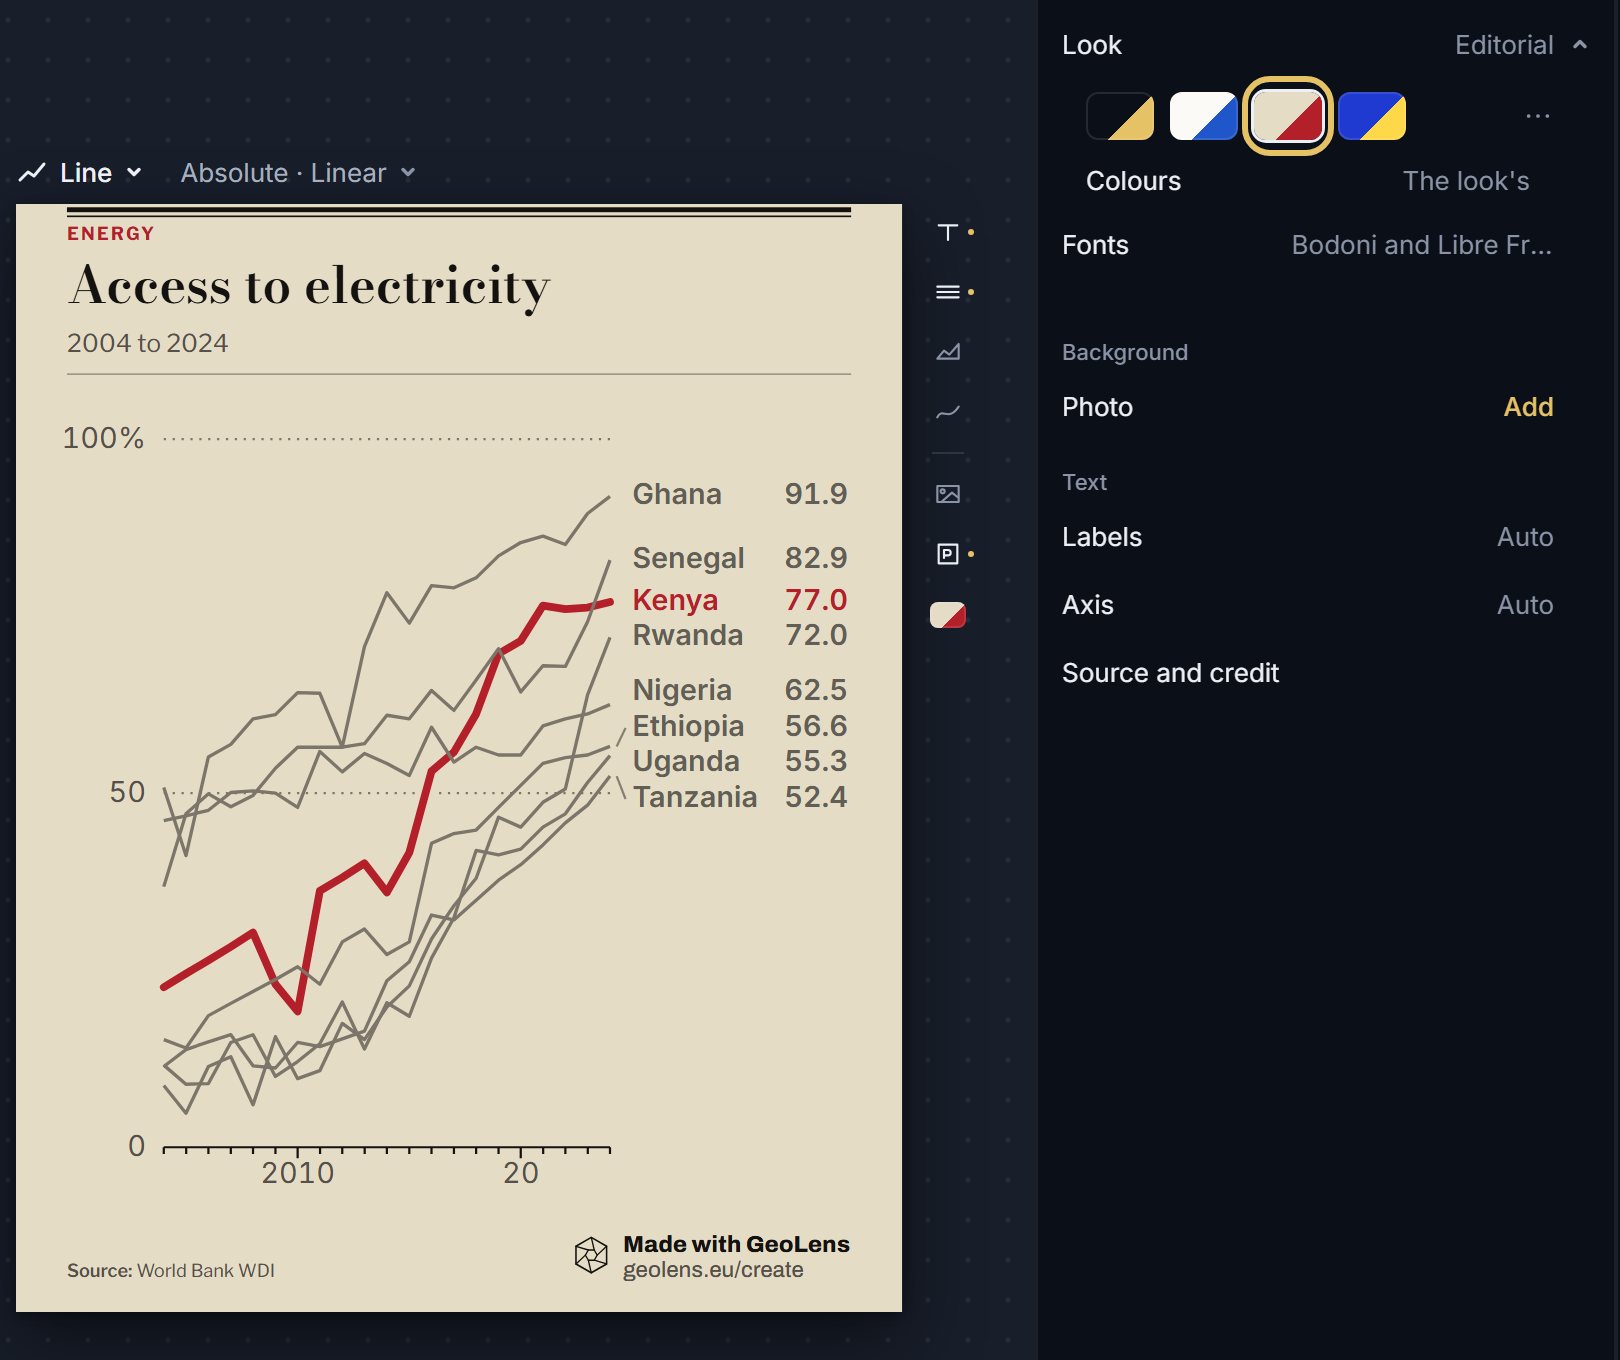
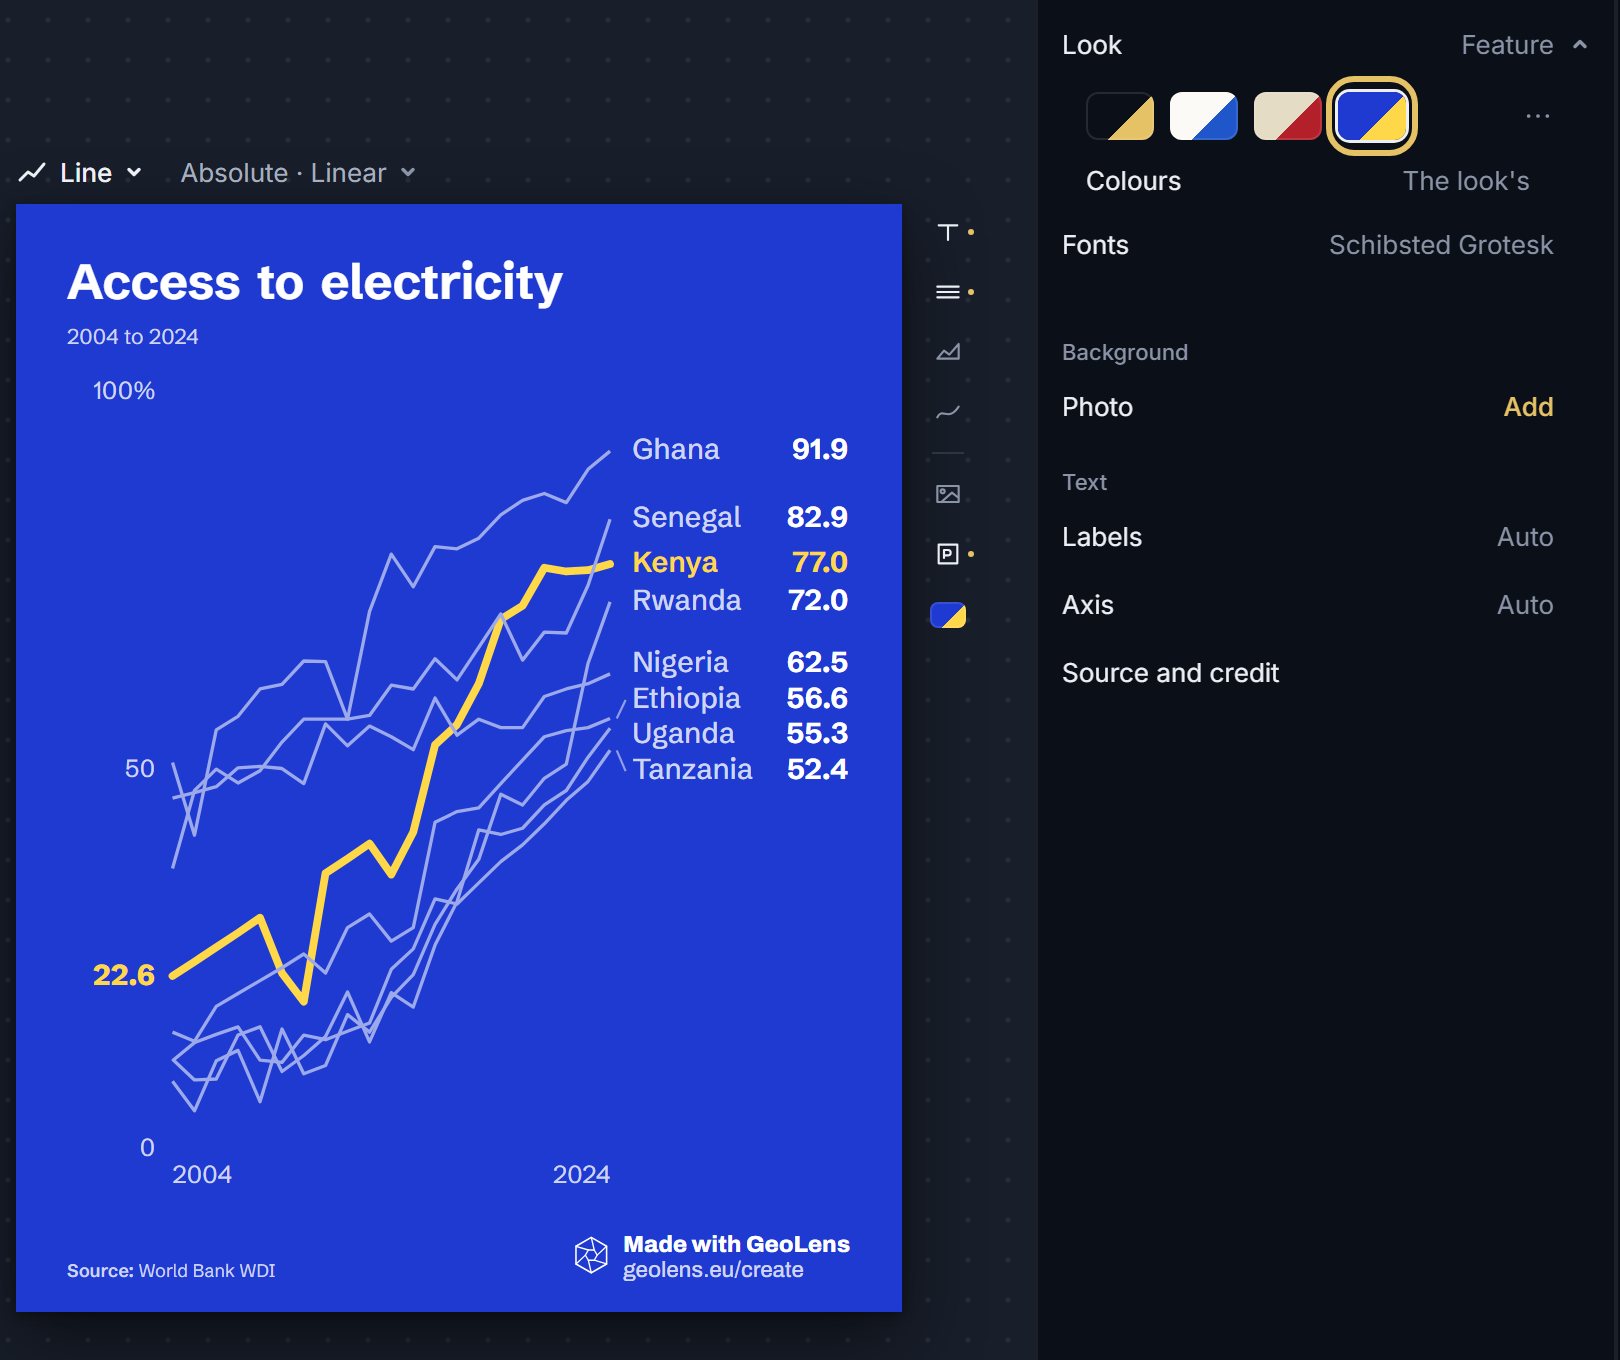
Four looks of one chart. Each picture rings the swatch in the Look row.
Open the Design tab. House is the default: a dark ground with a gold accent.
Choose Paper for a light ground that suits print and white pages.
Choose Editorial for a warm, newspaper feel.
Choose Feature for a blue ground and a bold finish.
TipCheck the look in the frame you will post: a social feed is dark, a report page is light.
Which looks are free
House and Paper are on every plan. Editorial and Feature are on PLUS and PRO.
On PRO, a brand kit saves your own logo, colours and fonts, so a look can match your organisation. Colours and fonts have a guide of their own.
How to choose a look
House is a dark ground with a gold accent. Paper is a light ground with a blue accent. Editorial is a warm cream ground with a red accent and a serif display face. Feature is a blue ground with a gold accent.
Each look brings its own fonts, which you can read in the Fonts row. A look carries the colours and type; the chart's words, data and layout do not change when you switch.
To see a chart the way readers will, change the look last, after the data and the title are final, and look at the whole frame once.