How to find and read an indicator
Updated 8 Nov 20261 min read
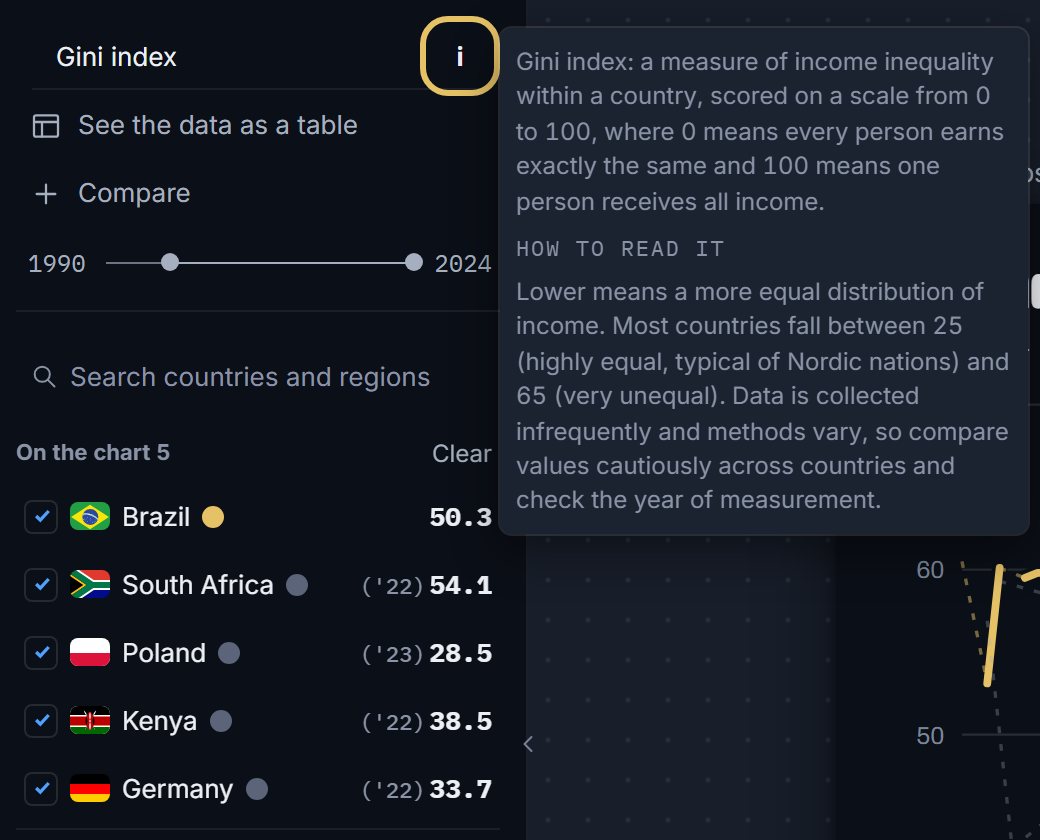
Press the indicator name at the top left of the studio, then search by name or filter by tier, source and topic. Each result says who published it, for how many countries and to which year. Press i beside the chart's indicator to read what it measures and how to read it.
What an indicator is
An indicator is one measured series for many countries over many years, such as GDP per person or access to electricity. Every built-in indicator is free on every plan.
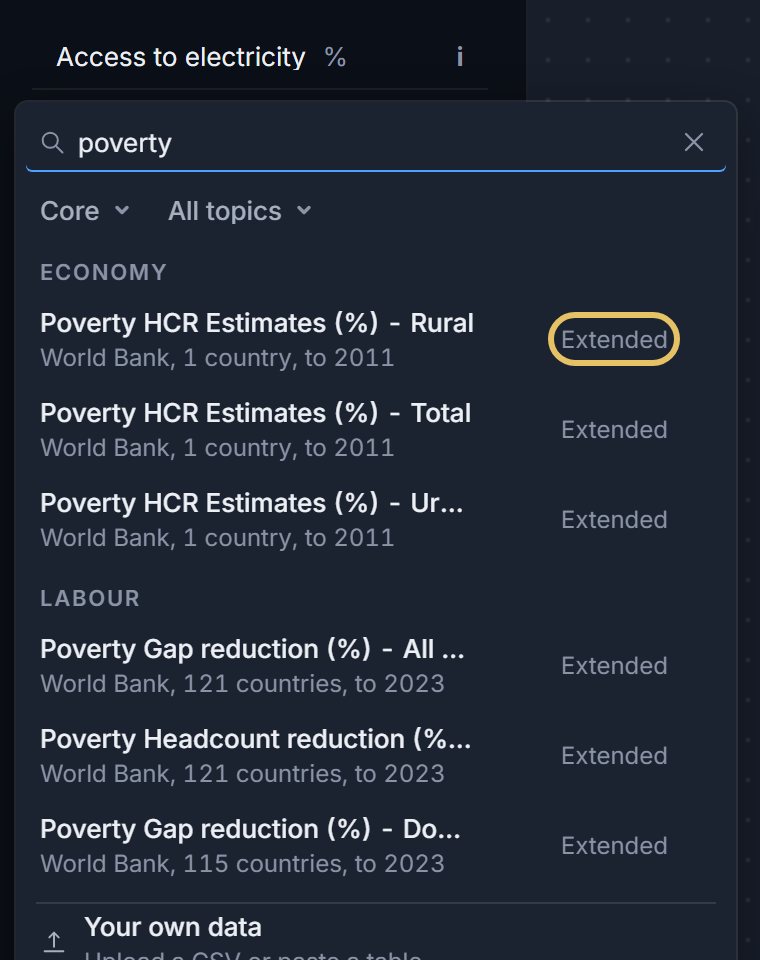
The picker lists indicators in two tiers, Core and Extended. The filter starts on Core, and an Extended result carries its tag.
How to find an indicator, step by step
Five steps. Each picture shows the control to use, ringed in gold.
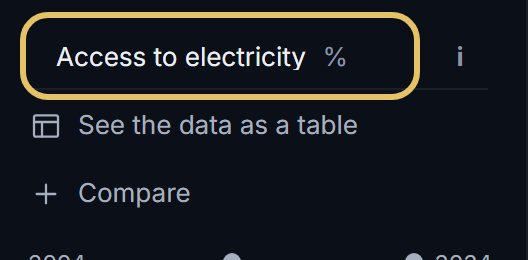
Press the indicator name at the top of the data pane.
Narrow the list with Core, All sources and All topics, or type a word in the search box.
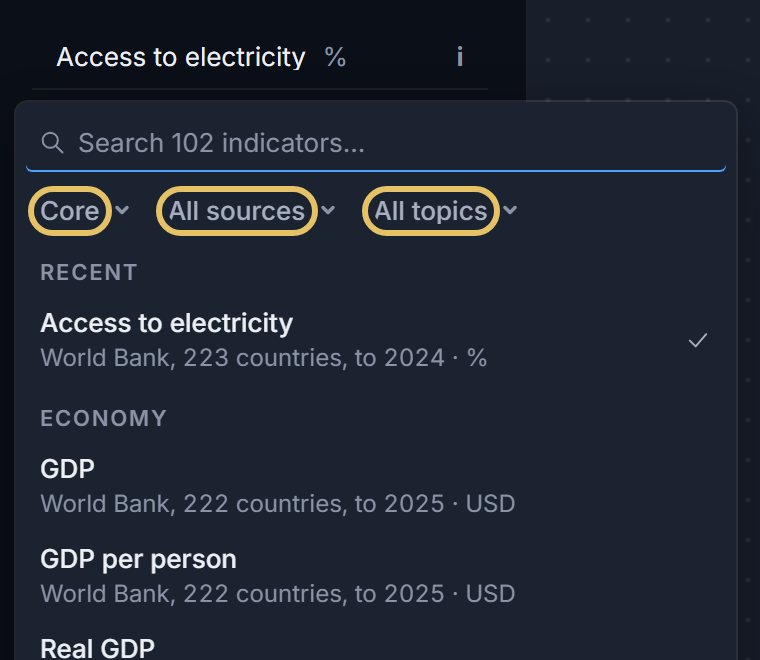
Read each result's second line: the publisher, how many countries it covers and the latest year. A series that covers one country or ends years ago is a weak choice.
Press i beside the indicator to read what it measures and how to read it, before you draw conclusions from it.
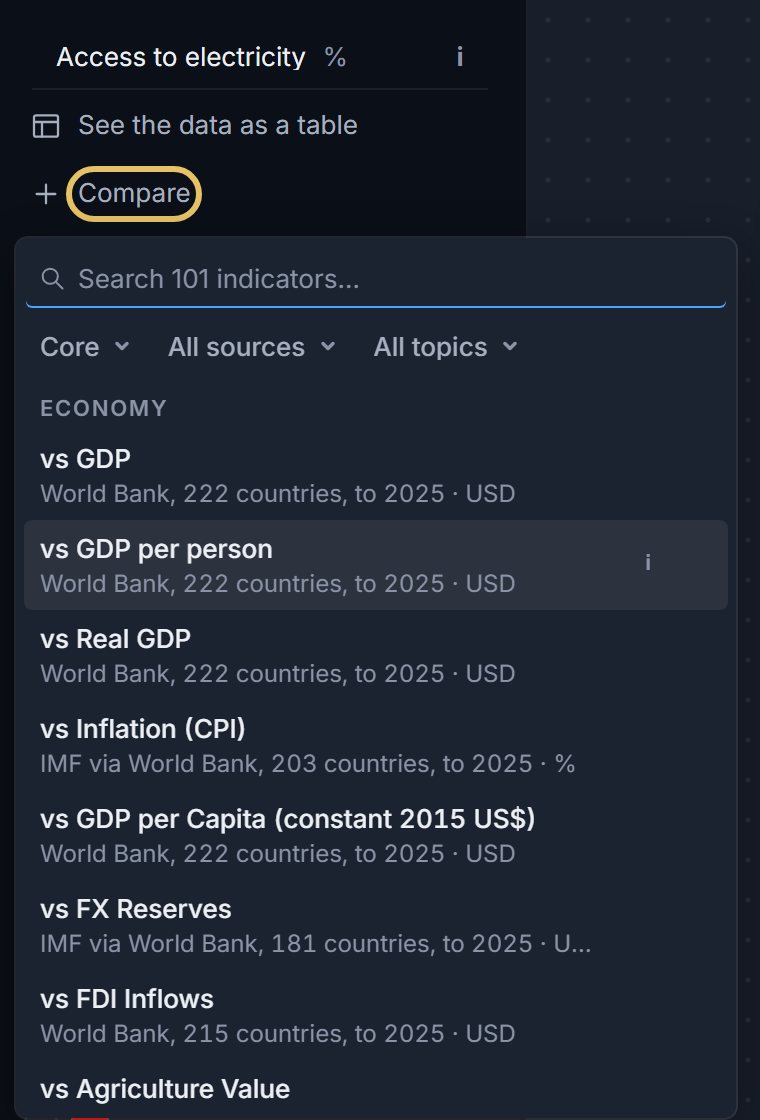
Press Compare to add a second indicator to the same chart.
TipRead the unit in the result line before you pick: the same name can be a share, a count or an index.
When the indicator is not in the list
The last row of the picker is Your own data: upload a CSV or paste a table. The guide to your own data covers it. For where the numbers come from, see where to find country data.
How to read a result line
Each result gives its name, then one line such as World Bank, 223 countries, to 2024, and its unit. The picker keeps the indicators you used last under Recent and groups the rest by topic, such as Economy or Labour.
A name can hide a different series, so compare the unit and the publisher before you choose between two similar results.