How to add data and sources to a map video
Updated 9 Nov 20261 min read
To put numbers in a map video, drag a data block such as Bars or Time chart from Blocks onto the word where it should show, then fill in its card: a title, one row per value, the unit, the date and the source. The story's sources are listed under the words, where New source adds one.
Numbers on the map
A data block puts a small chart on the map for as long as its words are spoken: bars to rank, a pie for shares, a time chart for a trend and a flow for what moves between places.
The pictures show the France power video, one of the finished videos under Start from, opened as a copy to edit.
How to add data and sources, step by step
Four steps in the Story video studio. Each picture shows the control to use, ringed in gold.
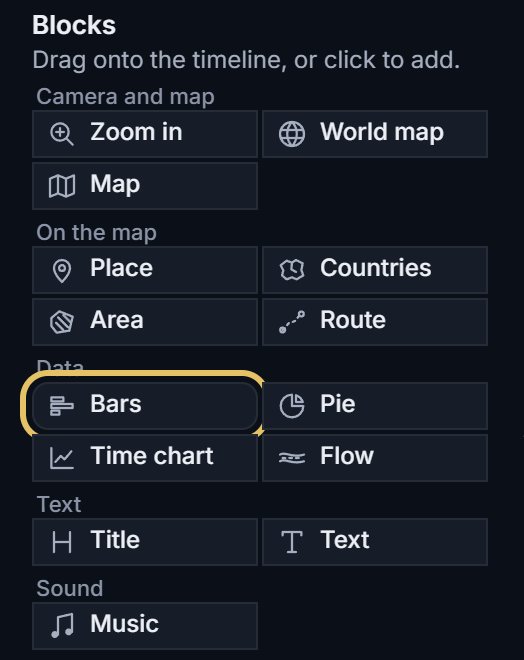
Under Data in Blocks sit Bars, Pie, Time chart and Flow. Drag one onto the word where the number should show, or click it to add it at the playhead.
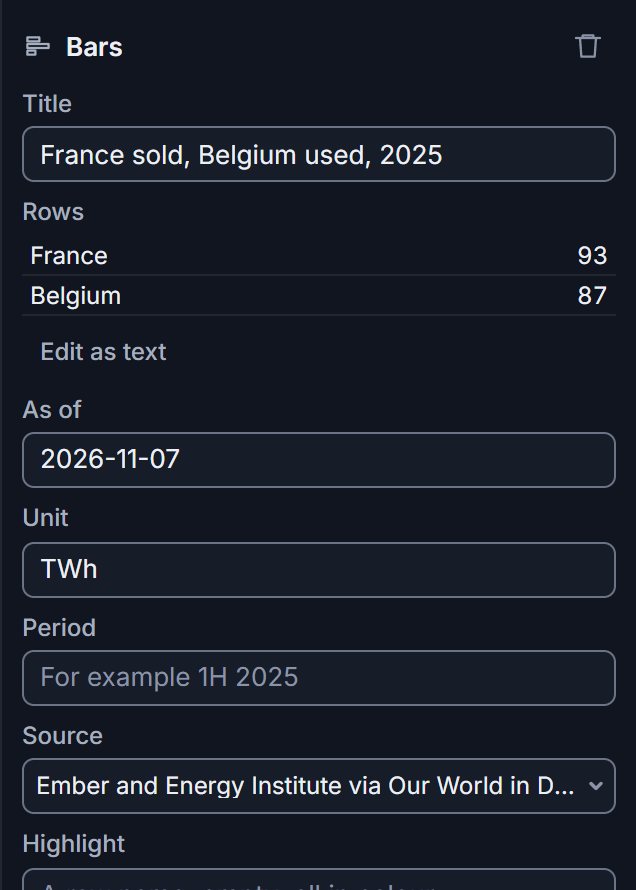
Press a block on the timeline to open its card. Type the title and one row per value, or press Edit as text to paste the rows. Then set As of, the unit, the period and the source.
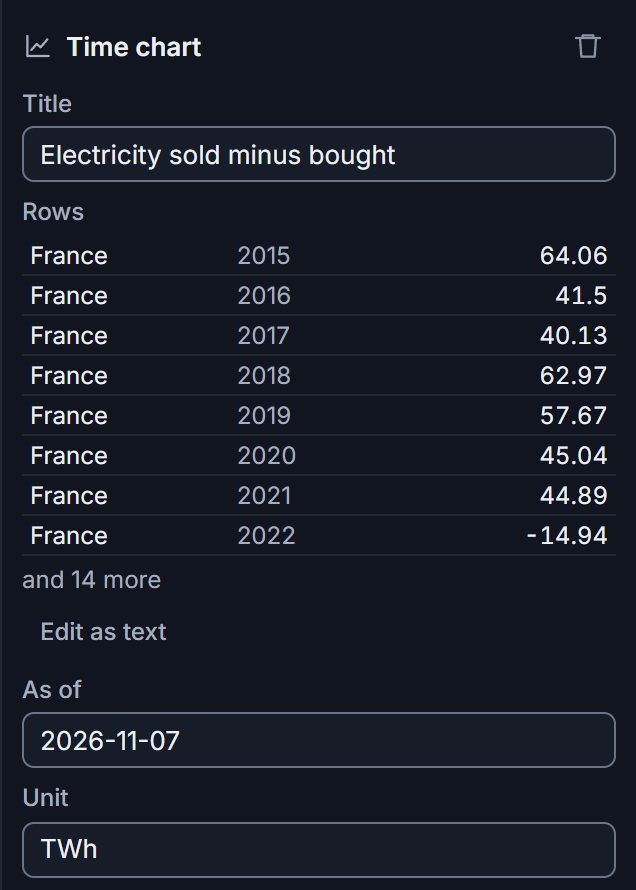
A Time chart takes one row per year. Here France's net sales of electricity dip below zero in 2022, the year France bought more than it sold.
The story's sources are listed under the words. Press New source, pick its kind, say what you cite and paste the link, then press Add the source.
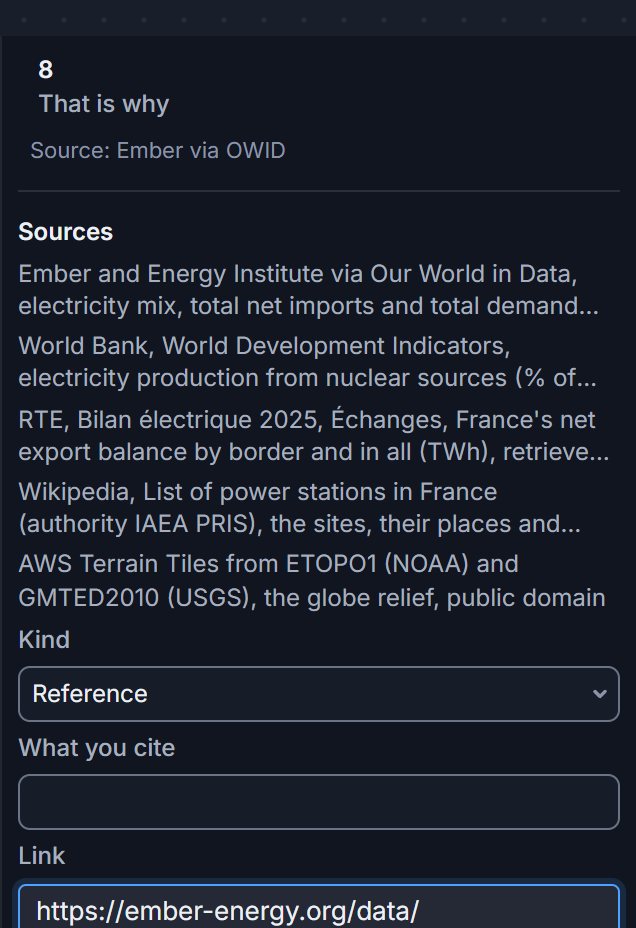
TipGive every number on screen a source. The notes flag a number without one before you download.
Check the numbers before the video goes out
A source someone has not checked yet carries an I checked it button. Press it once the number on screen matches the source at its date: a video with an unchecked source cannot be published.
Round the numbers for the screen. 93 reads at a glance; 93.27 does not.