Line chart race maker
Pick an indicator, the years and the countries, and each line grows one year at a time, so viewers watch the gaps open and close.
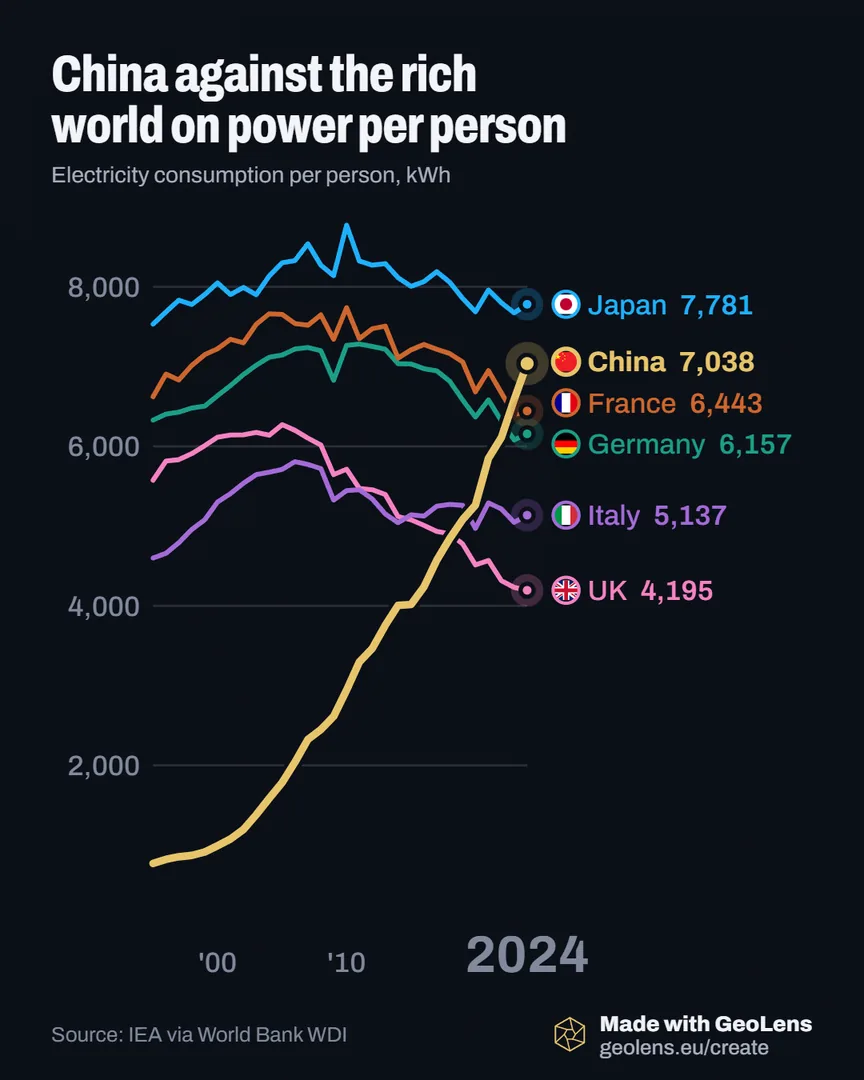
What you get
- A line per country
- The first country in the list wears the highlight, and every line carries its flag, name and value at its head.
- Passes flagged
- The editor flags each time one line passes another, and the music can drop on a pass.
- Text at the moment
- Pin one line of text to a year and it shows as the race passes that year.
- Ends as a line chart
- The last frame is a finished line chart, so the same chart works as a still.
Questions
What do I get from the line chart race maker?
An animated line chart for your countries on any indicator in the data library, with the source and the years printed on the frame, ready to export as a video.
How do I start?
Open the example above in the editor, then swap the indicator, the years and the countries for your own.
Is it free?
Making a race takes a free account. Downloading the MP4 comes with PLUS. Compare the plans