Per capita vs total: which number to chart
Updated 8 Nov 20262 min read
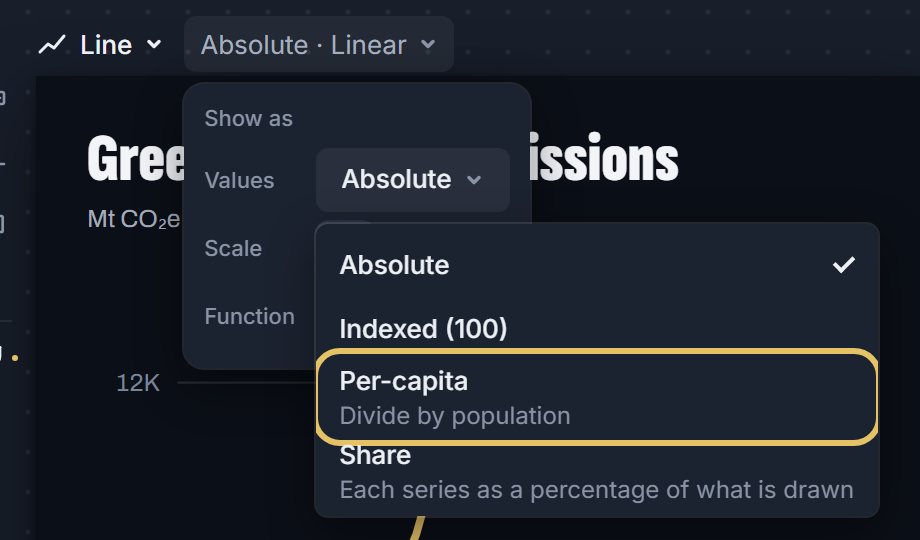
Chart the total when the question is about size, such as who emits the most. Chart per capita when you compare countries of different sizes. In GeoLens, open Show as above the chart and choose Per-capita.
The same data gives two different answers
Totals rank countries by size. China emits more greenhouse gas than the next four countries combined, and this chart shows it in one picture.
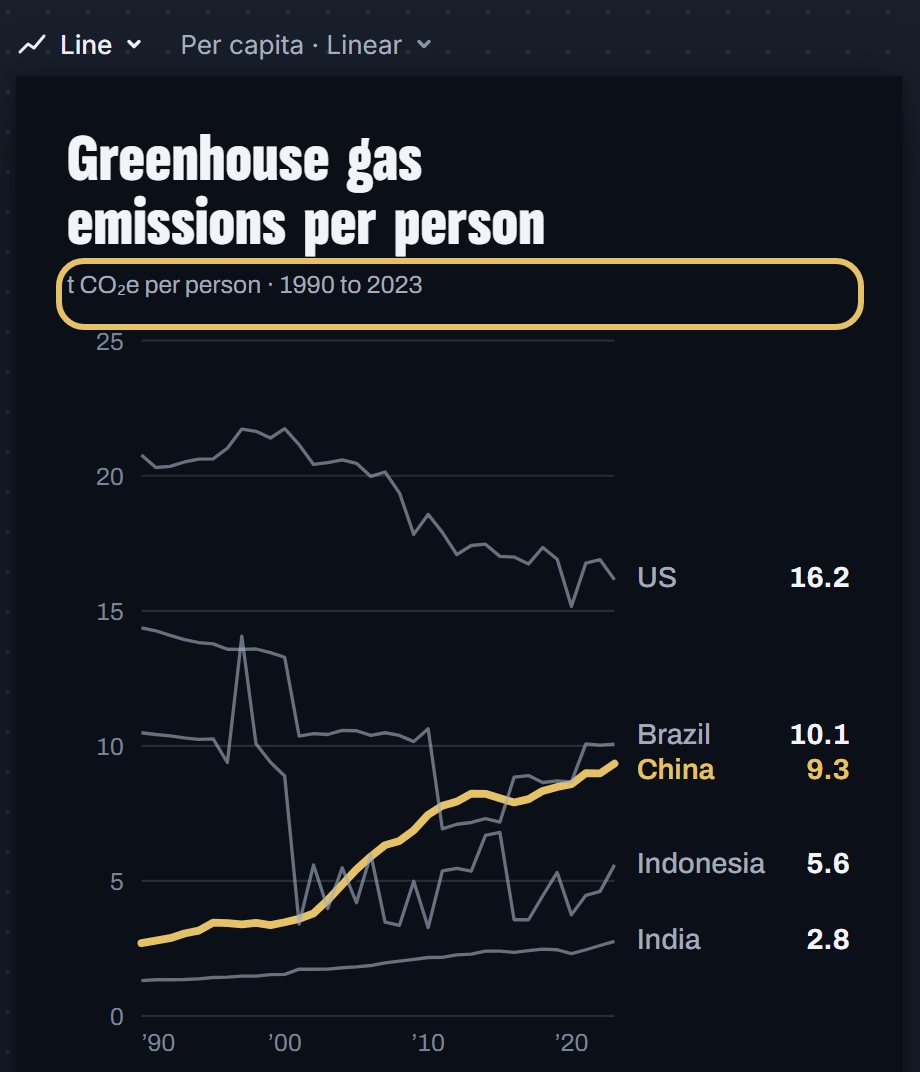
Per person the order changes: in 2023 a resident of the US emitted 16.2 tonnes and a resident of China 9.3, a little more than half as much.
Stacked area chart of greenhouse gas emissions in China, the US, India, Brazil and Indonesia, 1990 to 2023, with China highlighted.
How to switch a chart to per capita, step by step
Six steps on a chart of greenhouse gas emissions. Each picture shows the control to use, ringed in gold.
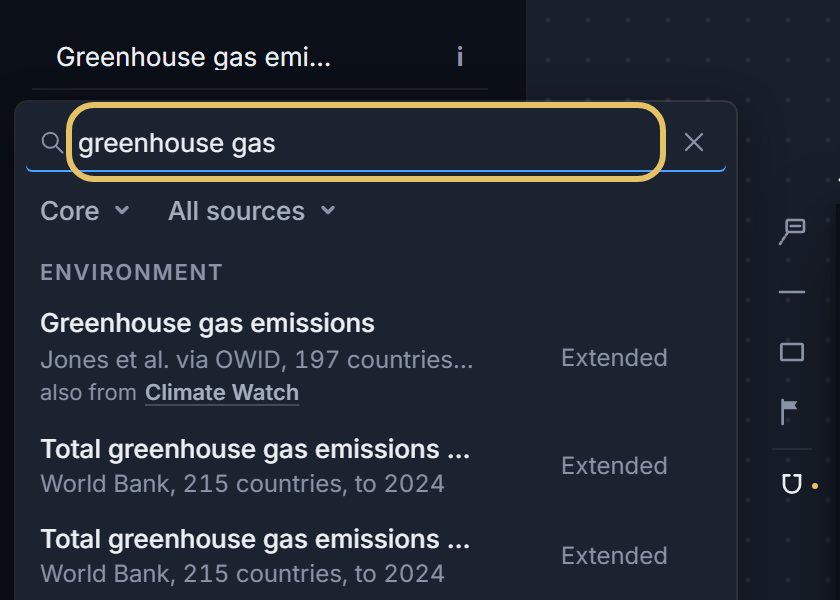
Open geolens.eu/create, press the indicator name at the top left and search for a total, such as greenhouse gas emissions.
Open Show as above the chart, then the Values menu, and choose Per-capita.
Read the new title and the line under it. Both now say per person.
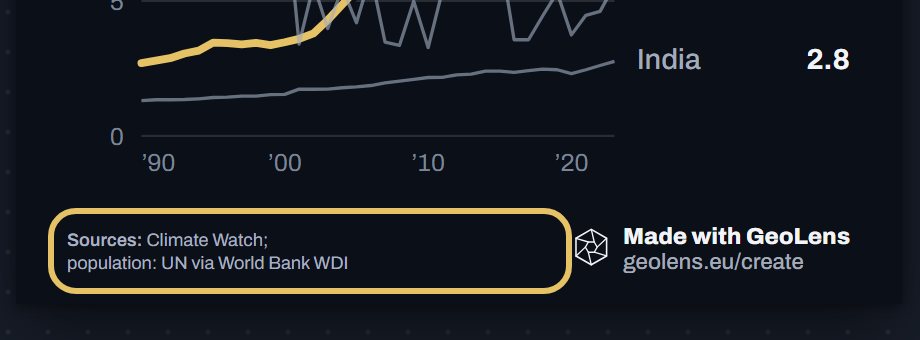
Check the source line. GeoLens divides by UN population figures from the World Bank and credits them under the chart.
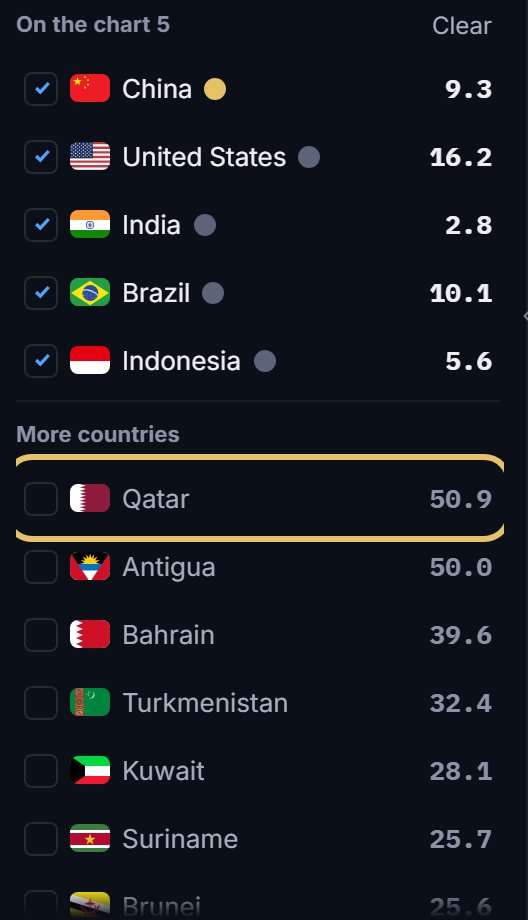
Look at the Add list. It now ranks countries per person, so small, high emitters such as Qatar rise to the top.
Open Download and choose PNG image.

TipIf the indicator is already a rate, such as electricity use per person or a share of GDP, do not divide it again.
Which number answers your question
Use the total for a share of a world sum, a country's weight in a market or the size of its army.
Use per capita to compare how much each resident produces, uses or emits.
Climate questions often need both: the total says who moves the world sum, per capita says how heavy each person's share is.
Mistakes to avoid
A country of a few thousand people can top a per person ranking. Say so in a note, or leave the tiny states out of the chart.
Write the title for the view you show. A title about the biggest emitter is wrong on a per person chart.
Choose Absolute in Show as to go back to the totals at any time.
Population grows, so a per person line can fall while the total rises. Say which one you show.