How to index a chart to a base year (= 100)
Updated 8 Nov 20262 min read
To index a series, divide every value by its value in the base year and multiply by 100, so every line starts at 100. In GeoLens, open Show as above the chart, choose Indexed (100) and pick the base year.
What an indexed chart shows
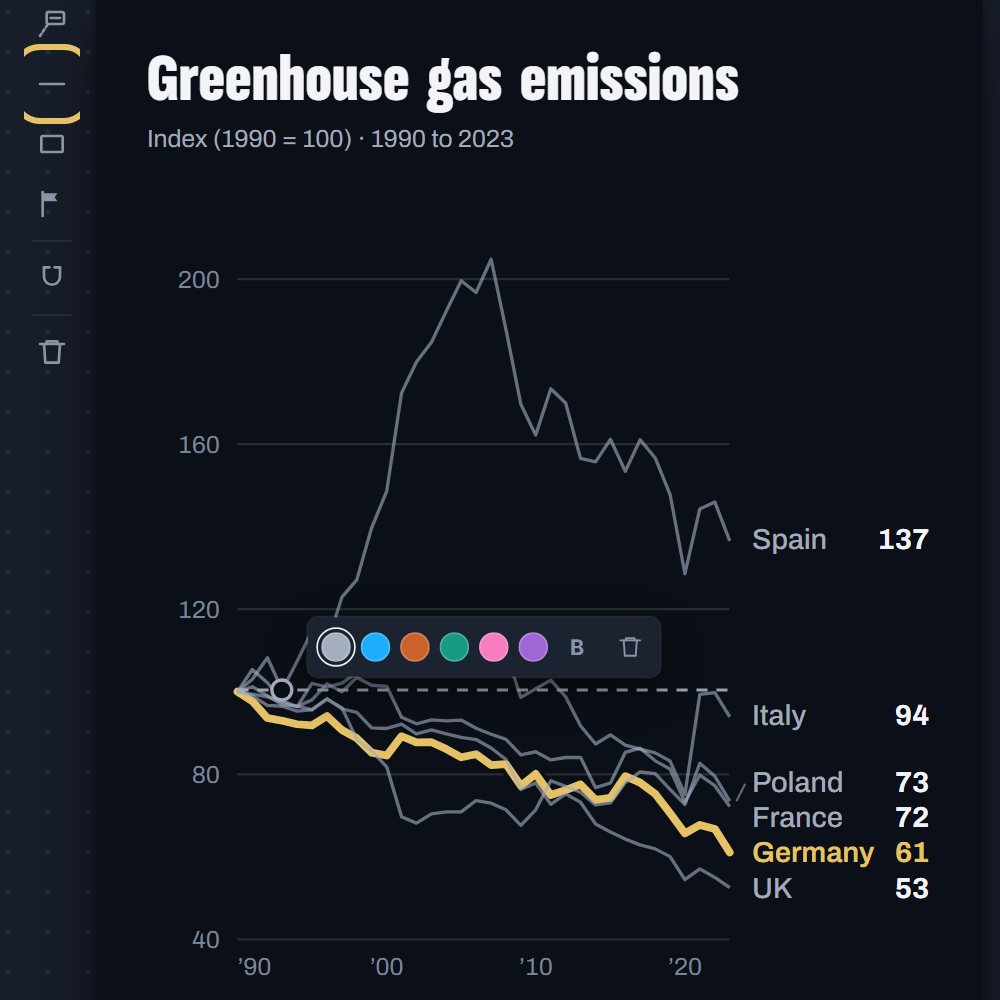
Germany emitted 670 Mt of greenhouse gas in 2023 and Spain 271 Mt, so on one scale the change in Spain is hard to see.
Indexed to 1990, every line starts at 100 and the chart shows the change: Germany ends at 61, Spain at 137, which means 37% above its 1990 level.
Line chart of greenhouse gas emissions in European countries indexed to 1990 = 100.
How to index a chart, step by step
Six steps on greenhouse gas emissions in six European countries. Each picture shows the control to use, ringed in gold.
Pick your measure and tick the countries. Their values can be far apart; the index puts them on one scale.
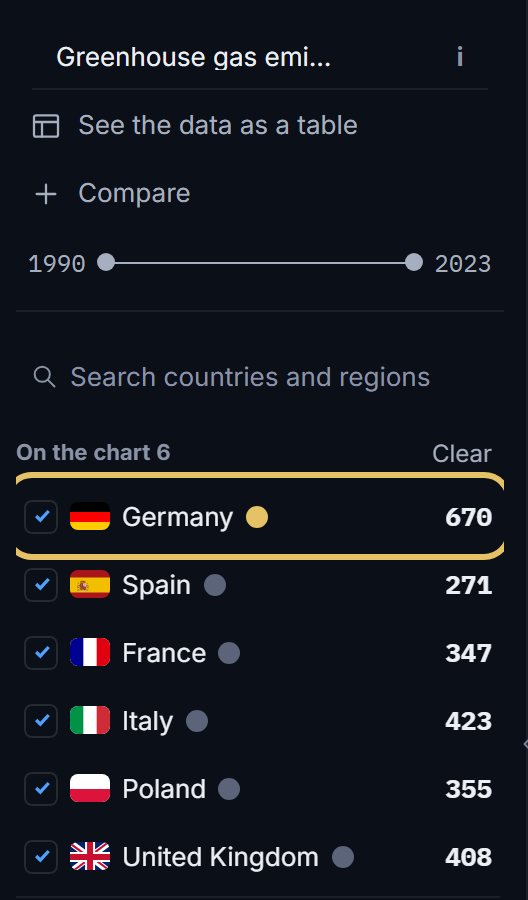
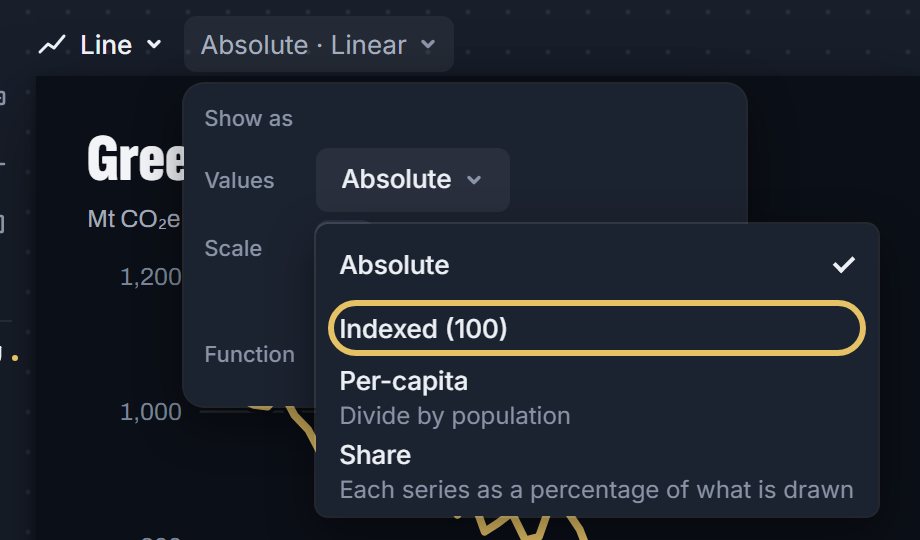
Open Show as above the chart, then the Values menu, and choose Indexed (100).
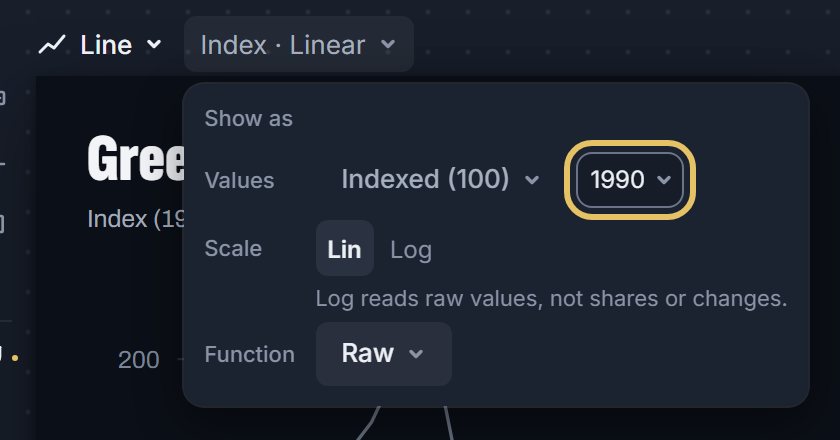
Pick the base year in the menu beside it. It starts at the first year of your range.
Read the line under the title. It names the base, Index (1990 = 100), and follows when you change the year.
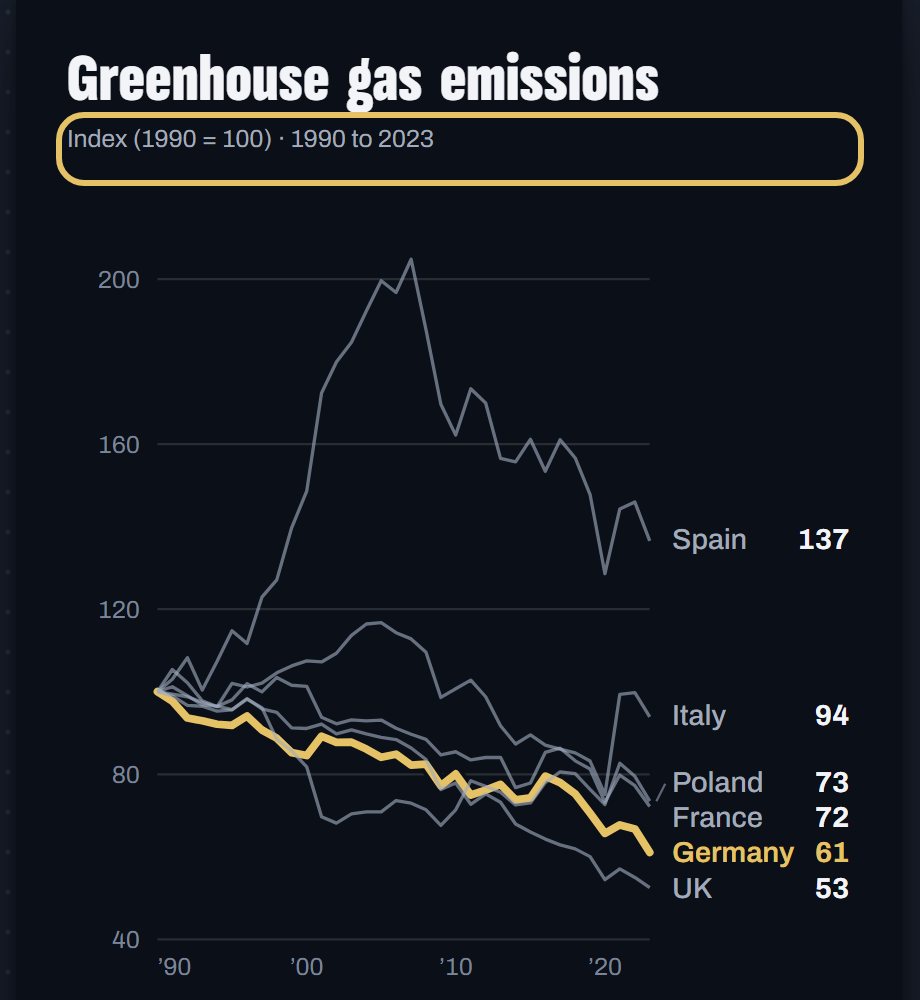
Turn off the magnet, press the horizontal line tool and click the chart at 100. Lines above it grew, lines below it shrank.
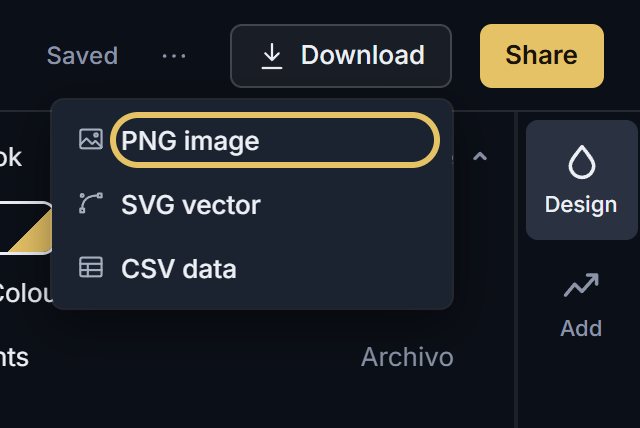
Open Download and choose PNG image.
TipEvery country needs a value in the base year, or its line has nothing to start from.
How to choose the base year
Pick a year that means something: a treaty, a crisis, the start of a policy.
Avoid a year that was unusually high or low, such as a recession or a boom, or every later value looks like a jump.
If countries joined a policy in different years, chart them apart rather than force one base on all of them.
An index shows change, not size
A country at 150 can still be far smaller than one at 80. Give the size in the text or in a note.
Some data comes indexed already, such as price levels with the US at 100. Then the base is a country, not a year, and the line under the title should say so.
Draw an index as lines. Bars from zero make 100 look like an amount, not a starting point.