How to make a line chart comparing countries
Updated 8 Nov 20262 min read
To compare countries on a line chart, choose Line in the GeoLens studio, pick one indicator and the countries, highlight the country your story is about and set the years. Put every country on a comparable measure first: a value per person, a share or an index.
What a line chart comparing countries shows
Years run left to right and each country gets one line, so the slope shows who grew faster and the crossings show who overtook whom.
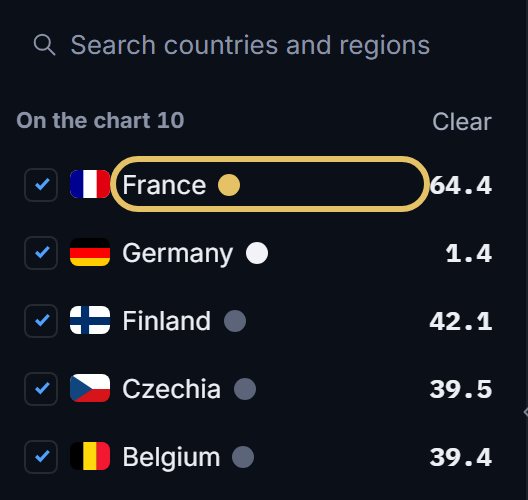
This chart holds ten countries, but France carries the colour, Germany is drawn in white and the other eight stay muted. Together they show the range a nuclear share can take: France stays at 62% or more from 1990 on, while Germany falls from 27.7% to 1.4%.
Line chart of the share of electricity from nuclear power in ten countries from 1990 to 2023, France highlighted and Germany in white.
How to make a line chart comparing countries, step by step
Each picture shows the control to use, ringed in gold.
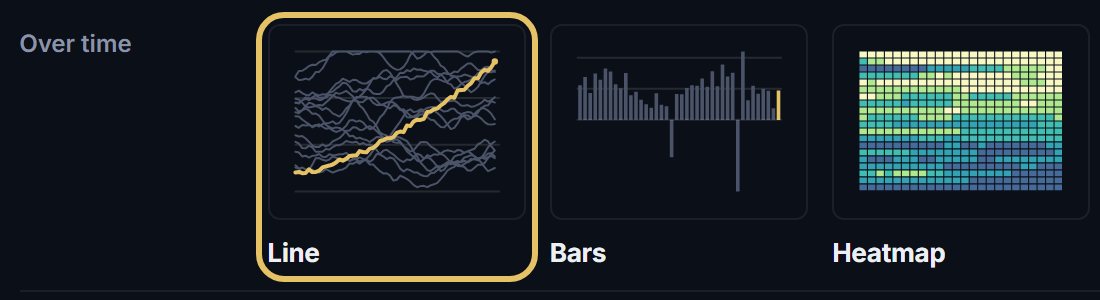
Open geolens.eu/create and choose Line, under Over time.
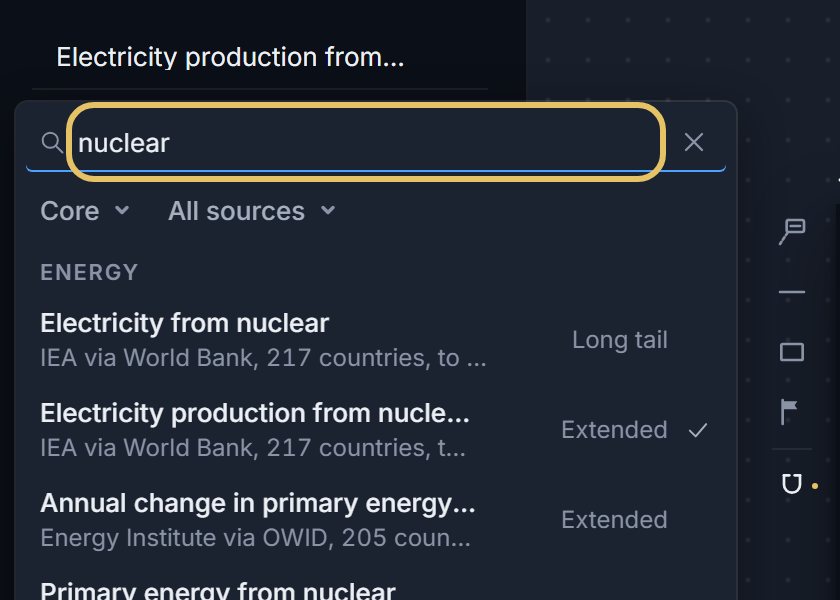
Press the indicator name at the top left and search for your measure, such as nuclear.
Tick the countries. The first in the list gets the highlight colour, so drag your story’s country to the top.
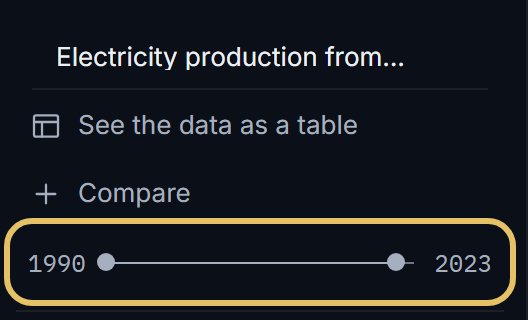
Drag the year range so the lines start where your story starts.
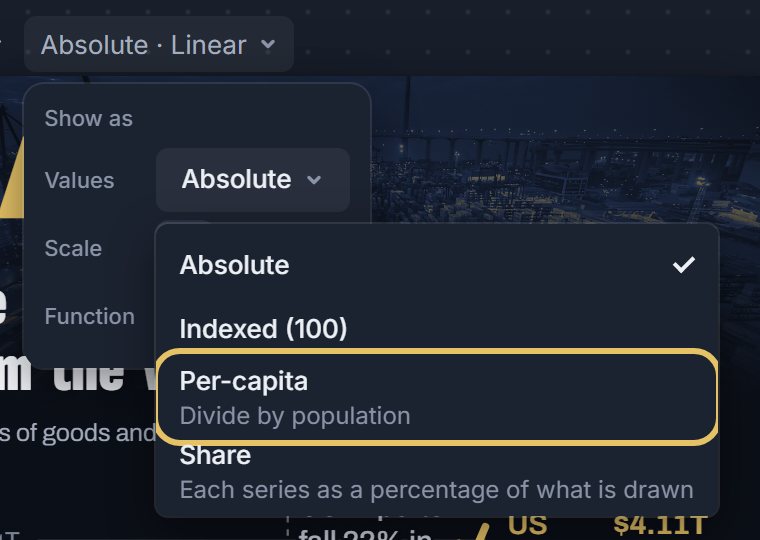
Open Show as to put the countries on one footing: per person where the measure allows it, an index where a base year is 100, or a share. The same menu switches the scale to Log.
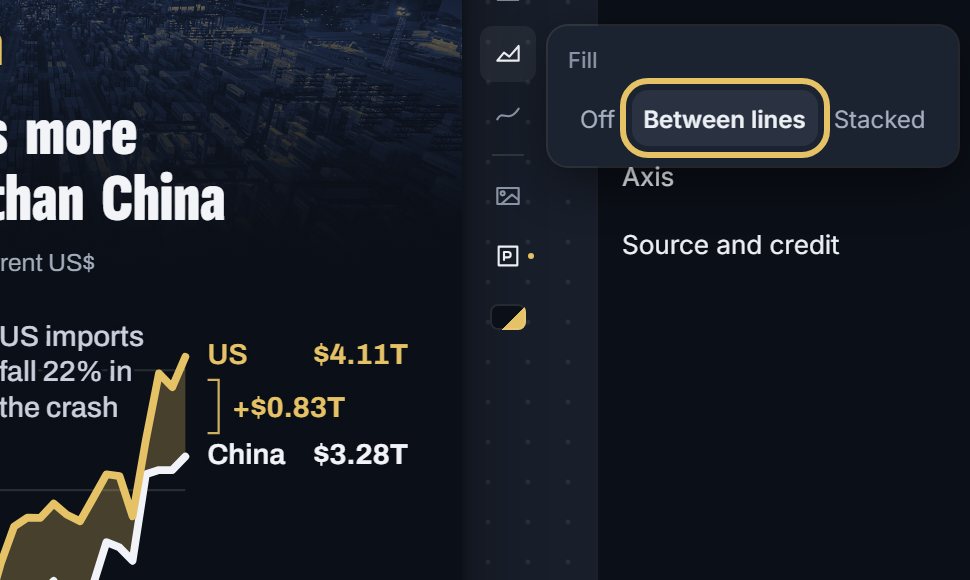
With two countries, open Fill on the right of the chart and choose Between lines. The gap becomes a shape and its size is printed at the end.
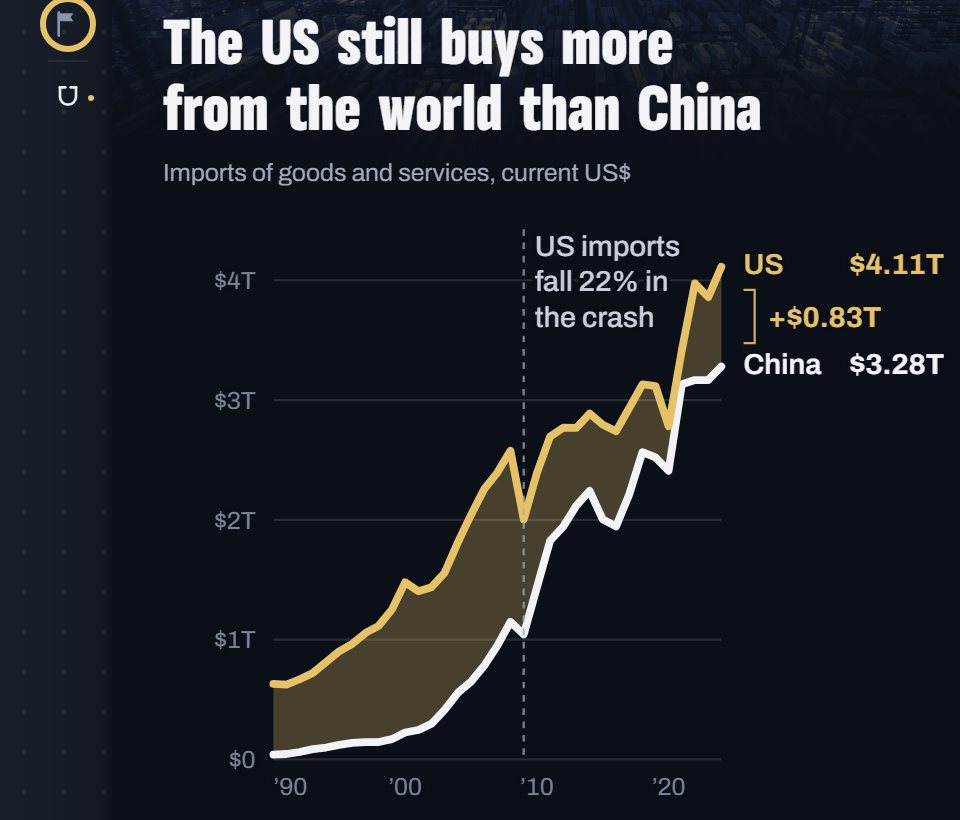
Pick the Event flag tool and press the year on the chart. The mark joins Layers, with a pencil to write its label.
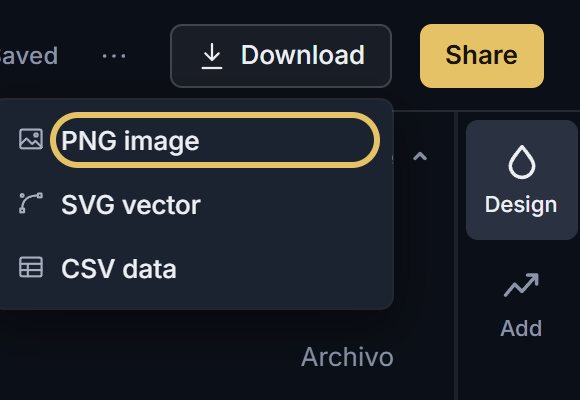
Open Download for a PNG image or the CSV data. SVG vector comes with PLUS.
TipKeep the muted lines when they show the range, and drop them when they only add noise.
Keep many lines readable
Name each line at its end instead of in a legend. GeoLens names the highlighted lines there, with their latest values.
When every country matters equally, choose Small multiples in the Shape menu for one small chart per country.
How to compare two countries
With two countries, the space between the lines is the story. Fill it, as here, and the reader can measure the gap year by year.
These values are in current US dollars, so price rises are part of the growth.
Mark events sparingly, only where a line changes direction, like the one sharp drop in 2009.
Press Share for a link or the embed code. An embedded chart updates when the data does.
Line chart of imports of goods and services in the United States and China from 1990 to 2024, with the gap filled and a 2009 event mark.