How to embed a live chart on a website
Updated 8 Nov 20261 min read
To embed a live chart, make it in the GeoLens studio, press Share, switch from Link to Embed and copy the code into an HTML block on your page. The code is an iframe that draws the real chart, so it fits your column and follows the data.
What an embed shows your readers
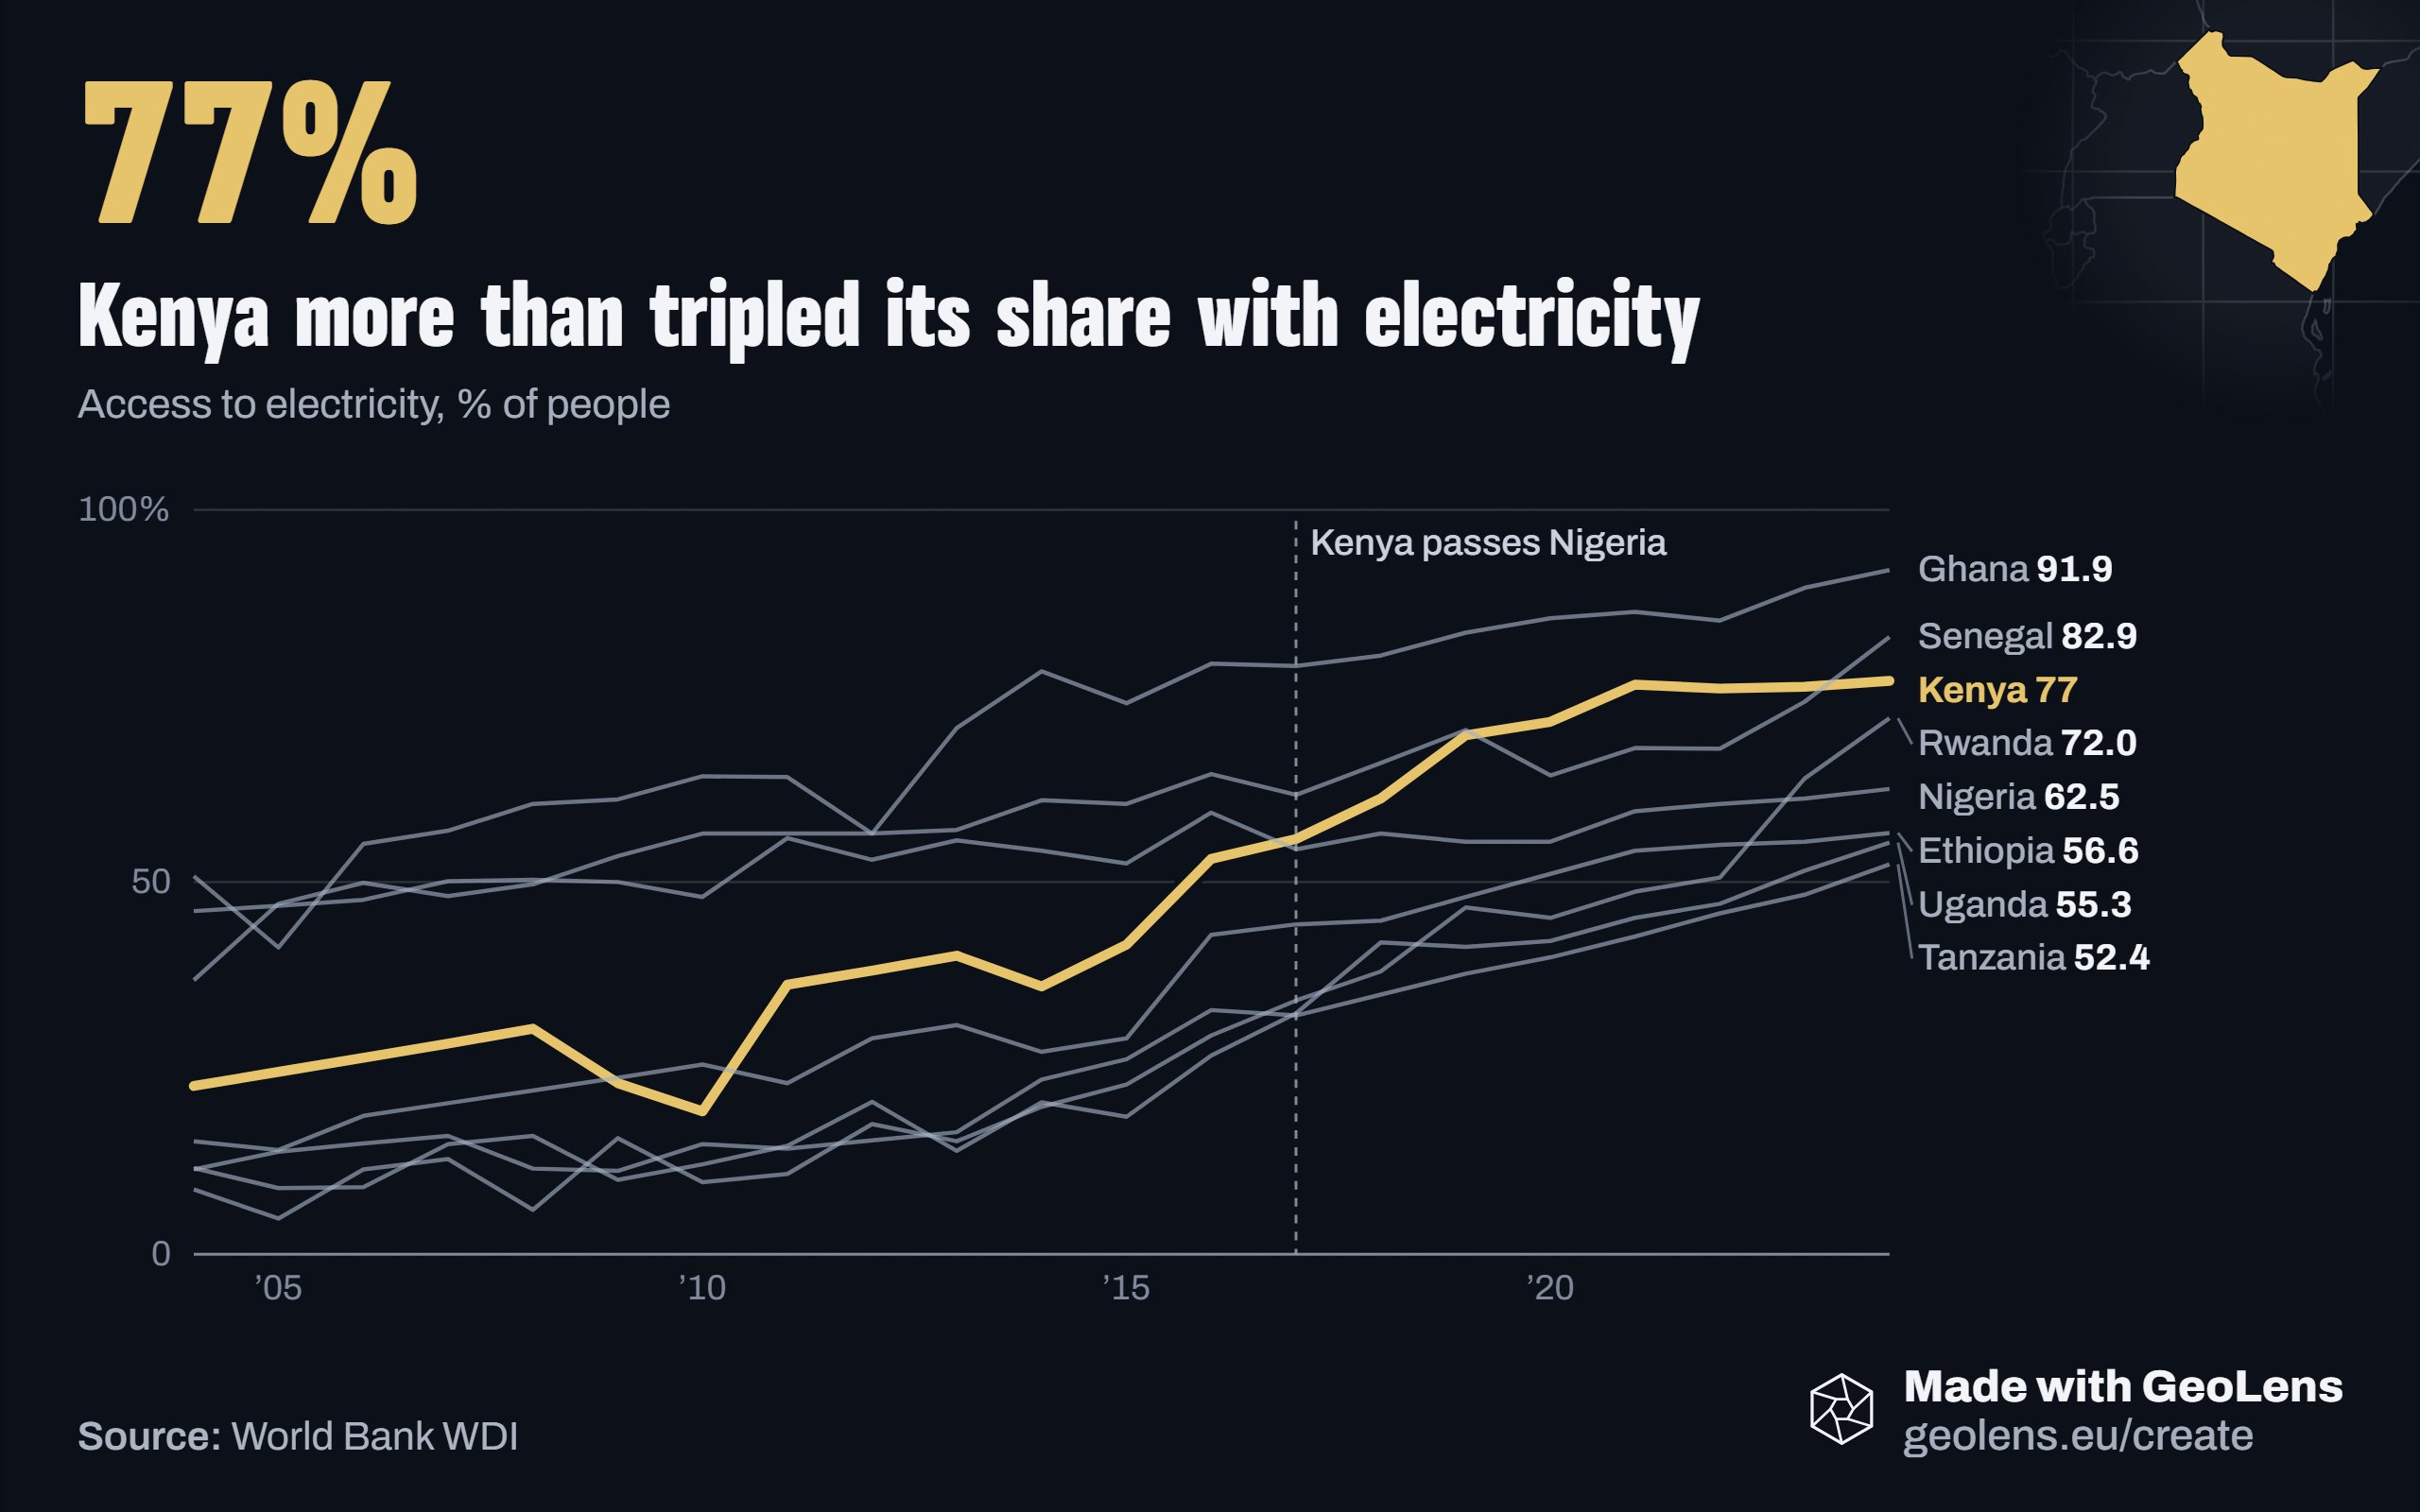
The reader's browser draws the chart each time the page loads. It fills the width of your column, sets its own height and shows the data as it stands that day. The chart below is drawn by the same embed frame.
Use an embed on your own site, in an article or on a report page people come back to. For a social post, an email or a slide, download a PNG instead.
Line chart of the share of people with access to electricity in eight African countries, 2004 to 2024, with Kenya highlighted and an event mark at 2017.
How to embed a chart, step by step
Five steps, from a new chart to the live frame on your page. Each picture shows the control to use, ringed in gold.
Open geolens.eu/create and choose a chart type, such as Line.
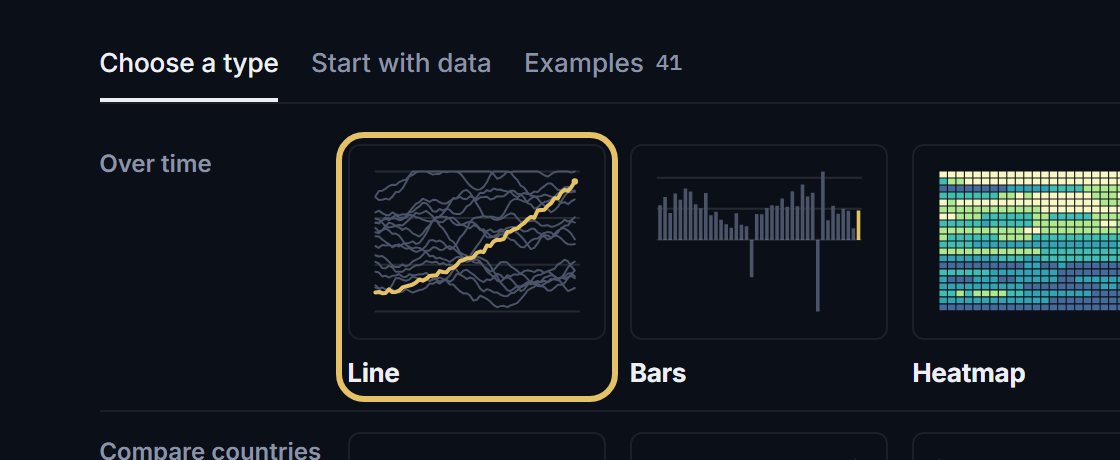
The chart opens straight away as a draft. To rename it, click its name in the bar.

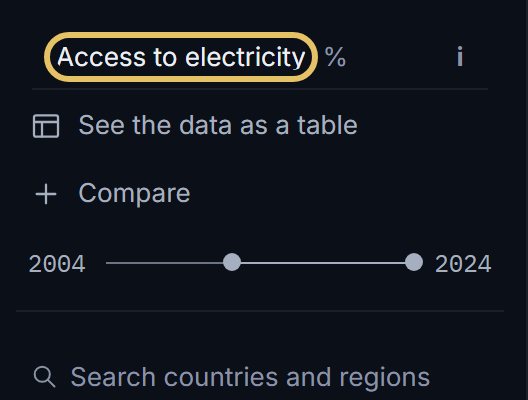
Pick the indicator, the years and the countries in the data pane.
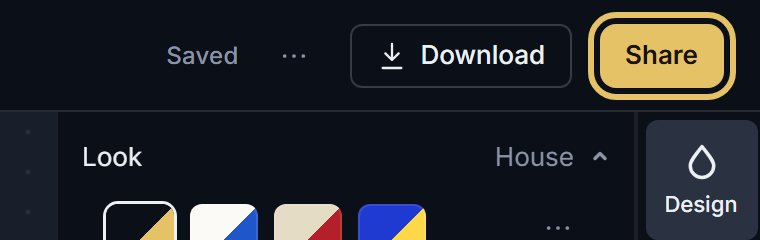
Press Share at the top right. In Share, switch from Link to Embed and press Copy.
Paste the code into an HTML or code block on your page and publish it. Readers see the chart without the studio around it.
TipGive the chart the full width of your text column, not a narrow sidebar.
Paste it so it works
Use an HTML or code block. A plain text block shows the code as words.
If your site has a strict content security policy, allow frames from geolens.eu.
If your site strips scripts, the frame keeps its shape and the chart still shows.
What updates and what stays fixed
The values follow the data as the sources revise it. Your title and notes do not, so read them again after a source's yearly release.
Values you edited by hand are not in the embed. It shows the published data and says "Shown without the author's edits to the data." When those edits matter, post a PNG instead.