How to annotate an event on a line chart
Updated 8 Nov 20262 min read
To annotate an event on a line chart, draw a thin rule at the year it happened and put a few words at its top. In the GeoLens studio, open Add, then Events, and type a year and the words, or pick a curated event from the list.
What a good event mark looks like
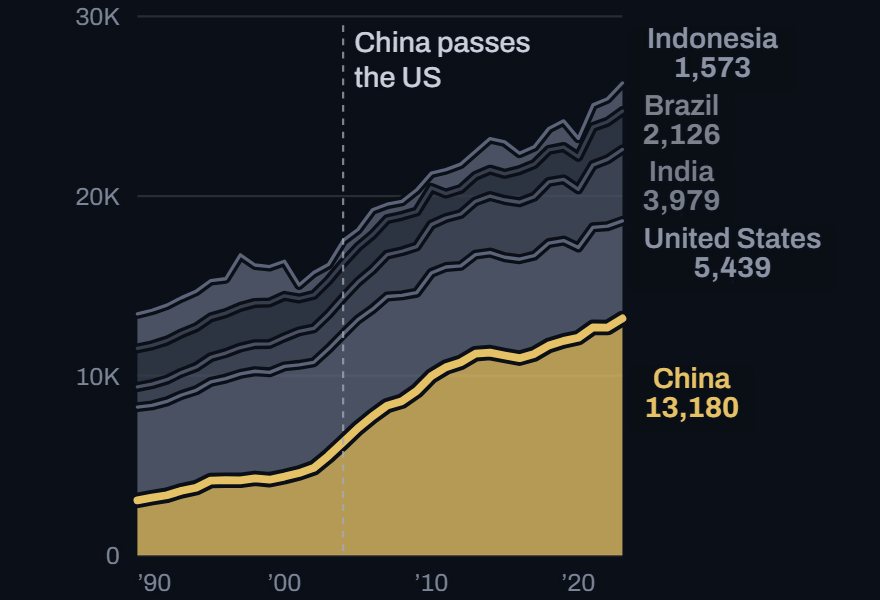
This stacked chart marks the year China's band grew larger than the band of the US. In a stack the reader cannot see that crossing, so the mark names it.
Without a mark, a reader sees a change and has to guess the cause. Draw the rule thin, so it sits behind the data.
Stacked area chart of greenhouse gas emissions from China, the US, India, Brazil and Indonesia, 1990 to 2023, with an event mark at 2004.
How to mark an event, step by step
Six steps on the chart above, from the Events list to captions in a race. Each picture shows the control to use, ringed in gold.
Open Add on the right. Under Events, type a year and a few words, such as 2004 China passes the US, and press Enter.

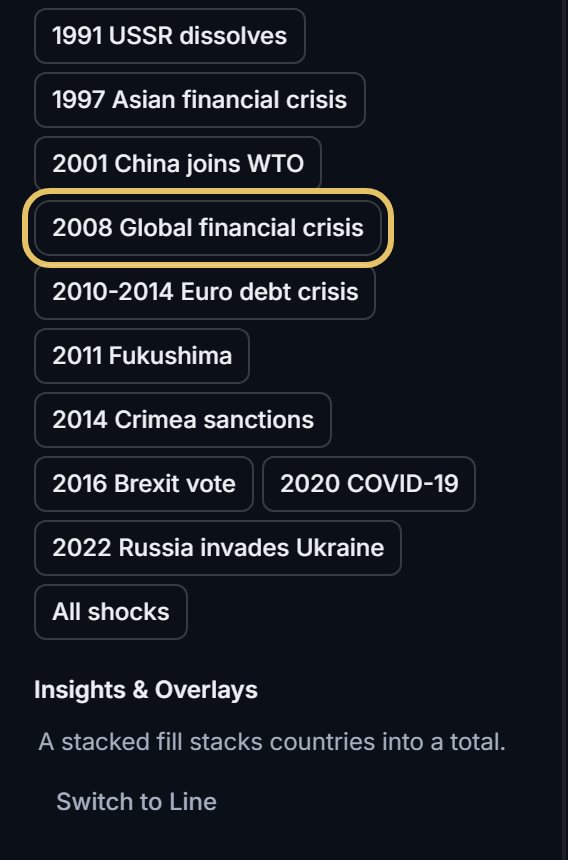
Or press one of the curated events. The list shows only events inside your years.
The event draws as a dashed rule at its year, with its words at the top of the plot.
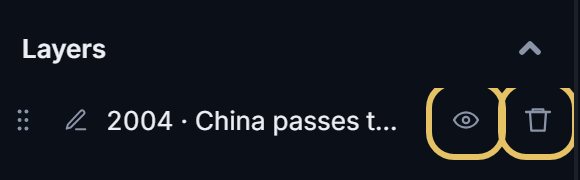
Each event is a layer. Press the eye to hide it, or the bin to remove it.
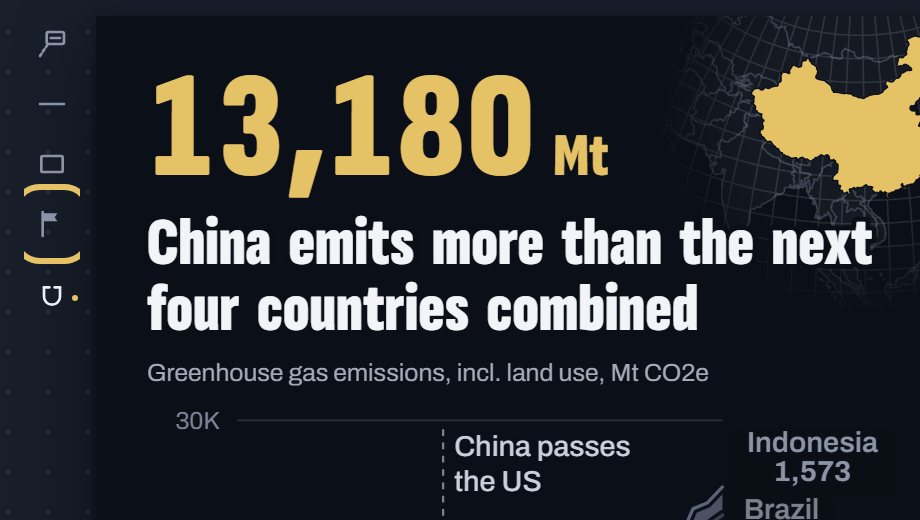
To place one by hand, choose the Event flag tool beside the chart and click the year.
In a bar or line race, events play as captions on the text track, each at its moment.

TipName who did what: "Iceland's banks collapse" beats "Financial crisis".
Write a label that explains the turn
Leave the year out. The rule already sits on it.
Write several events in the same tense and form, so the reader compares the events, not the wording.
Put a number in the label only when it matches the data on the chart.
Mark only what explains the line
Mark the year the event happened, not the year the data reacts. The lag is part of the story.
Keep it to a few events. A rule on every year with news hides the turn you want to show.
For something that lasted years, use a zone. For a target, use a horizontal line.