Bar chart or column chart: which fits country data
Updated 8 Nov 20262 min read
Use a column chart when the categories are years, and a bar chart when you rank countries at one year. In the GeoLens studio both are Bars: the years you set and the frame decide which way they run.
What is the difference between a bar chart and a column chart
Both draw one rectangle per category, and its length is the value, so both start at zero. Columns stand up from a horizontal axis; bars lie on their side.
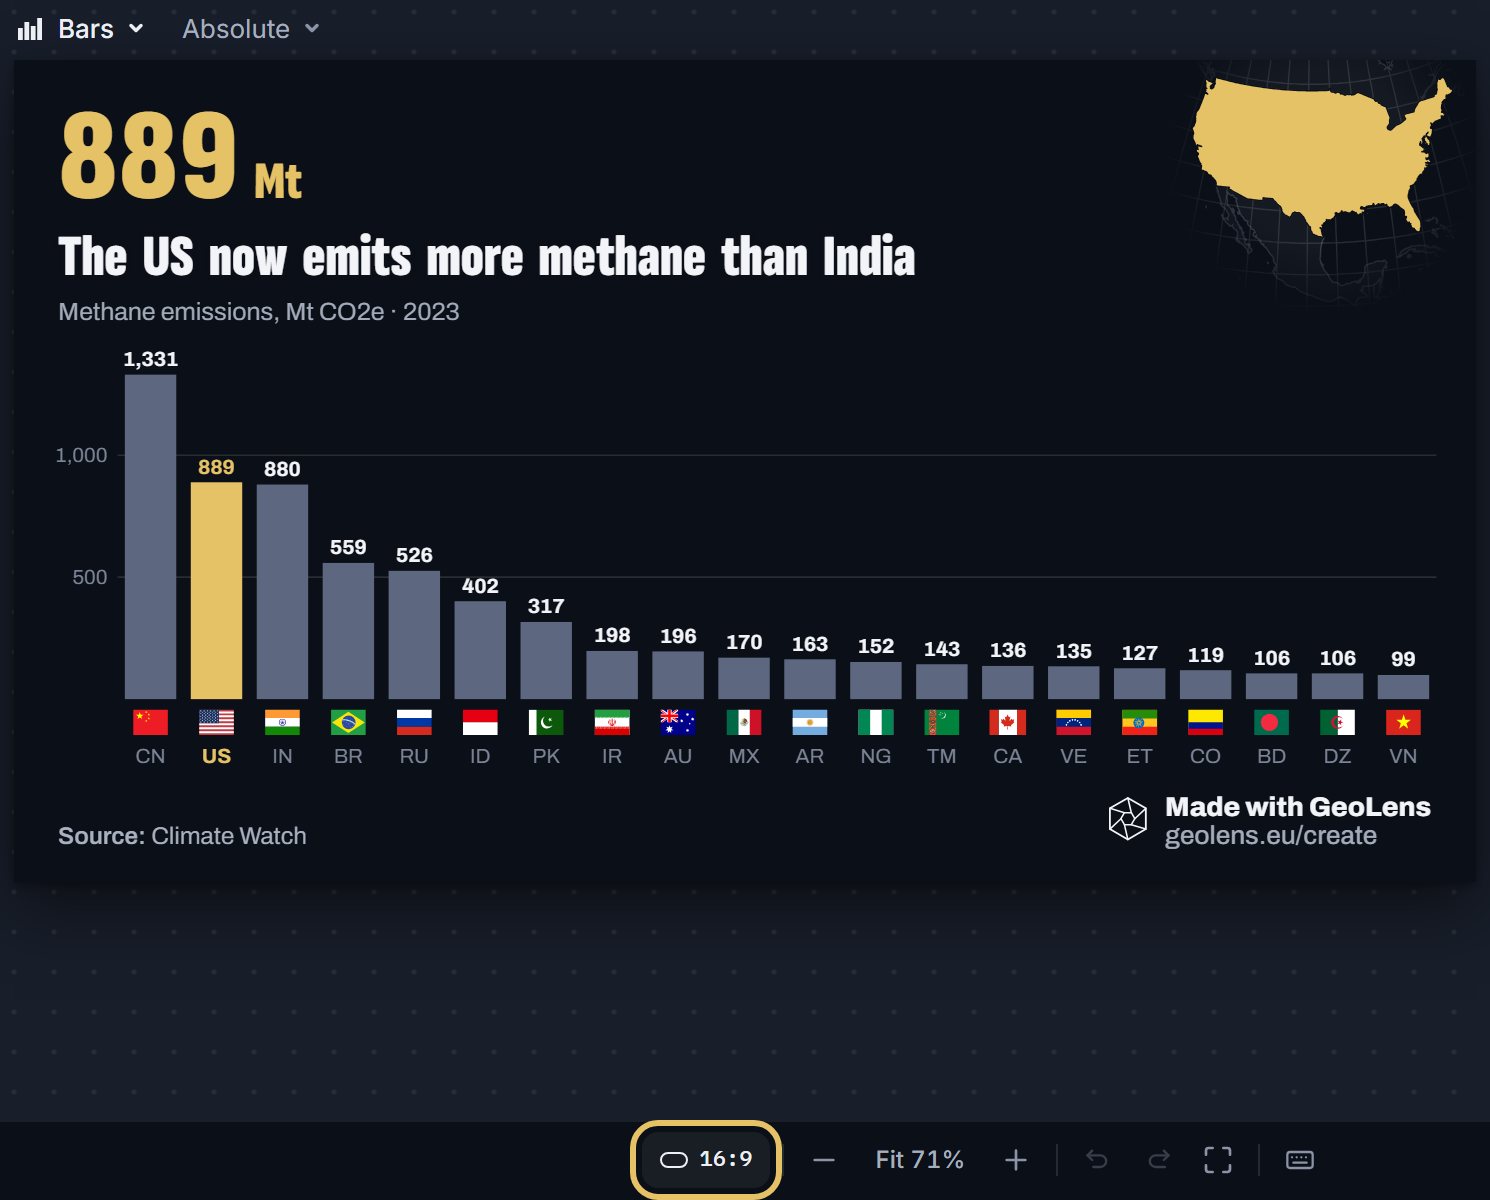
Columns suit years, because time reads from left to right. Bars suit a ranking of countries: each name sits on one line beside its bar, and the list reads from top to bottom.
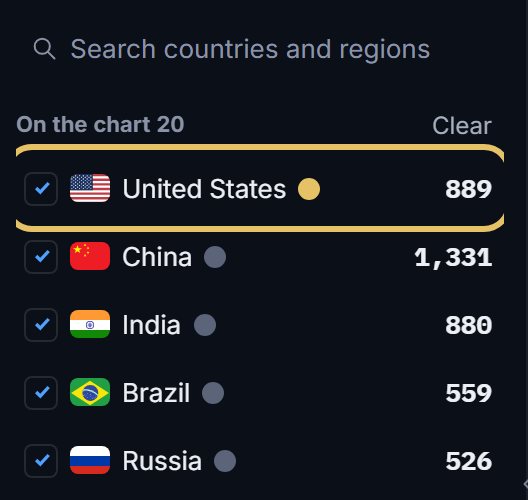
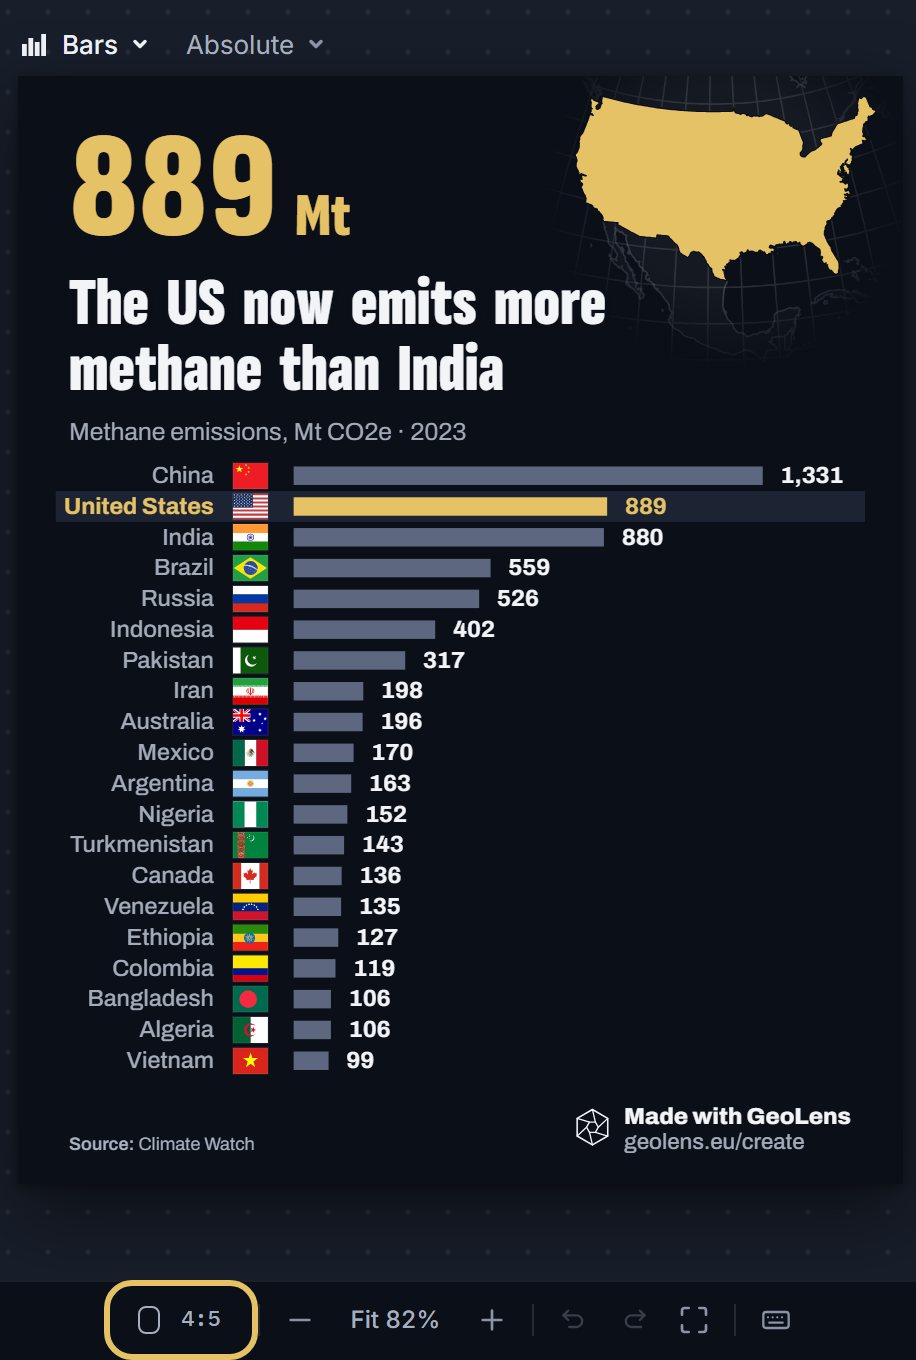
This example ranks 20 countries by methane emissions in 2023. The United States at 889 Mt CO2e and India at 880 stand side by side, so one highlight shows how thin the margin is.
Ranking of 20 countries by methane emissions in 2023, in Mt CO2e, with the United States highlighted.
How to make a bar or column chart, step by step
Seven steps on the methane example. Each picture shows the control to use, ringed in gold.
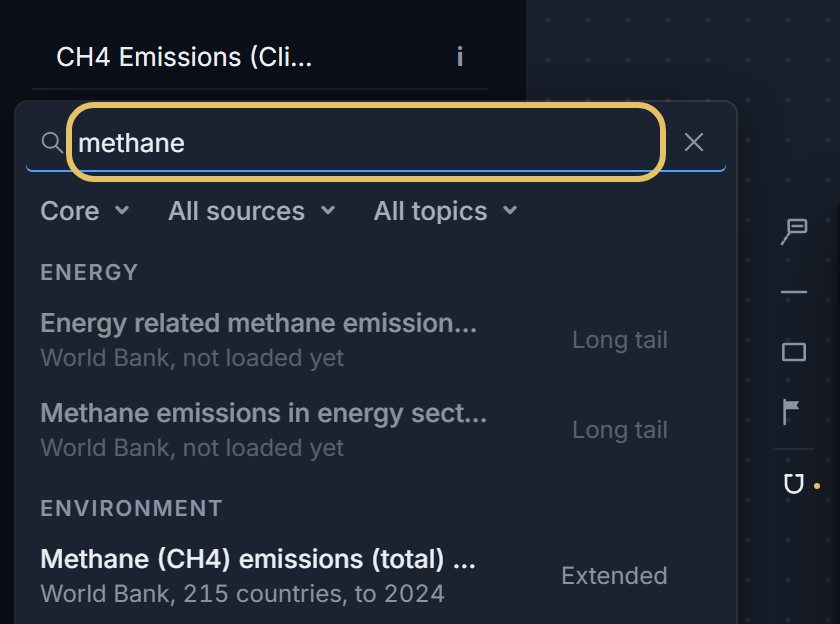
Press the indicator name at the top left and search for your measure, such as methane.
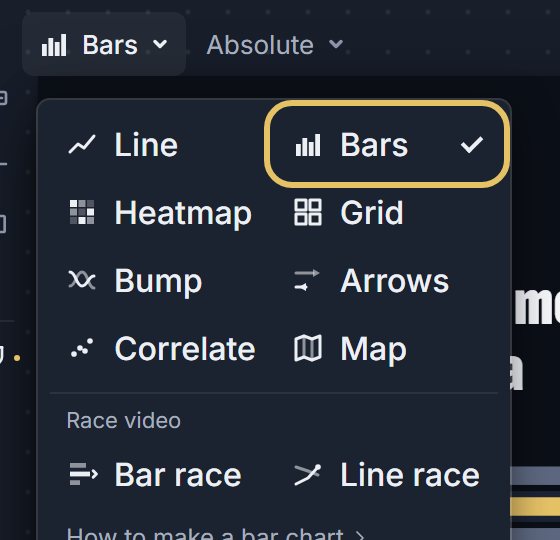
Open the Shape menu above the chart and choose Bars.
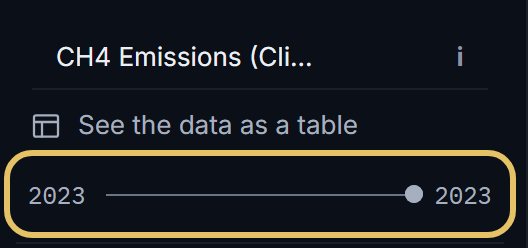
Drag both ends of the year range to one year, here 2023. One year ranks the countries; a range of years draws a group of columns per year.
The first country in the list wears the highlight colour. Drag your story’s country to the top.
Keep the 4:5 post frame for a ranking that runs down as rows. A 9:16 story draws rows too.
Press the frame button for the 16:9 link card. The same ranking now stands as columns, with flags under them.
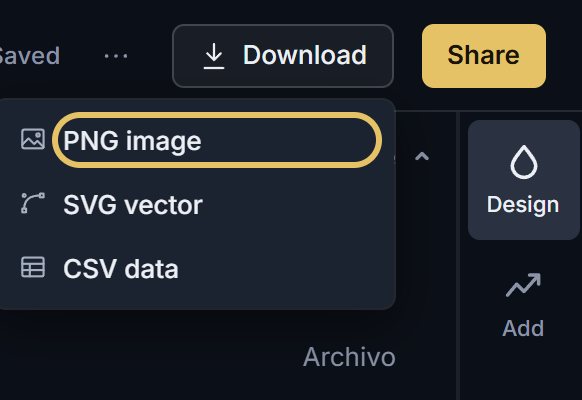
Open Download and choose PNG image. PNG works with a free account; SVG vector comes with PLUS.
TipSort a ranking by value, never by the alphabet, so the order shows who is first before anyone reads a number.
Rules for bars and columns
Start at zero. A bar cut off above zero makes every difference look bigger.
Print the value at the end of each bar, and give the highlight colour to one country only.
When every value is high and close, bars from zero look alike. In a post or story frame, GeoLens then draws dots on an axis fitted to the values. It does this when every value is above zero and the smallest is at least 70% of the largest.
How to show values below zero
A negative value runs the other way from the zero line, on the same scale. Net trade and budget balances need this.
Here, below zero means a country sold more electricity than it bought. Ordered lowest first, France comes first: it sold 93.3 TWh more than it bought in 2025, nearly three times Sweden at 33.6.
Write the sign rule into the caption, as this chart does, because a reader cannot guess what negative means.
Ranking of 15 countries by net electricity imports in 2025, in TWh, France highlighted, with bars below zero for countries that sold more than they bought.