How to make a small multiples chart
Updated 8 Nov 20262 min read
To make a small multiples chart, choose Small multiples in the GeoLens studio and pick an indicator and the countries: each country gets its own small panel. Use it when one line chart has too many lines to follow.
What a small multiples chart shows
Each panel is the same small line chart with one country's data, so the eye compares the panels without a legend.
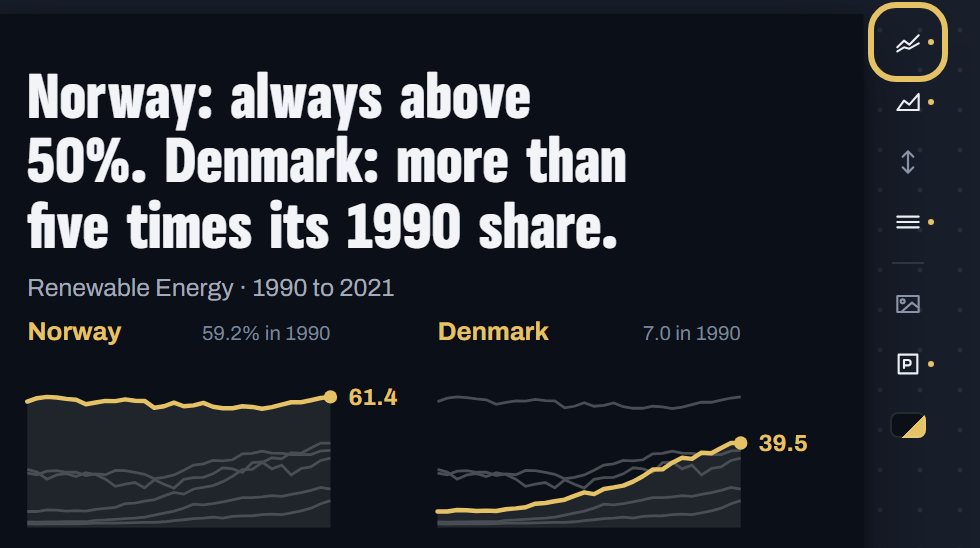
Here six countries share one scale. Denmark's climb from 7% to 39.5% reads directly against Norway, which never fell below 50%.
Small multiples of the renewable share of final energy use from 1990 to 2021, one panel each for Norway, Denmark, Austria, Portugal, Germany and the Netherlands, on one shared scale.
How to make a small multiples chart, step by step
Eight steps, from an empty studio to the PNG. Each picture shows the control to use, ringed in gold.
Open geolens.eu/create and choose Small multiples, under Over time.
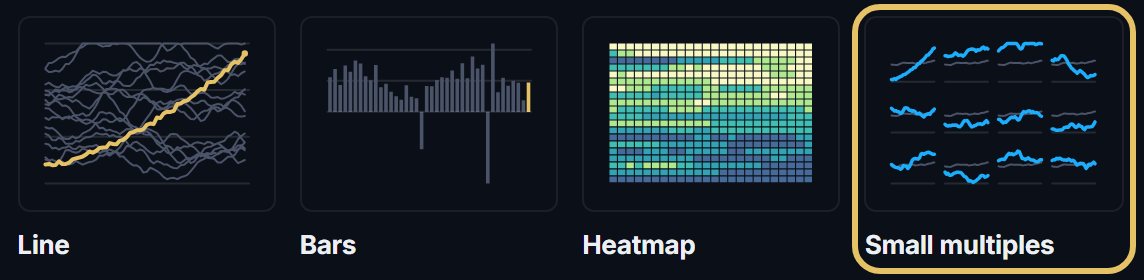
The chart opens straight away as a draft. To rename it, click its name in the bar.

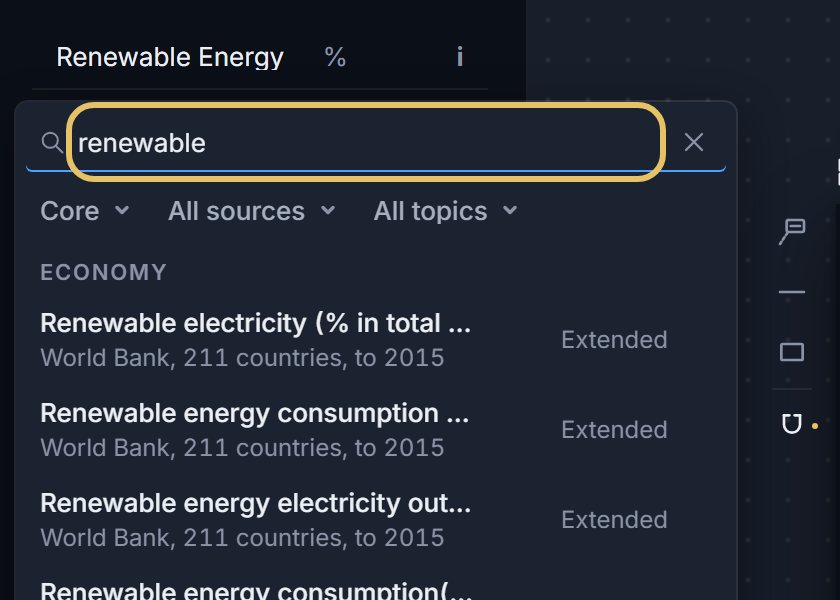
Press the indicator name at the top left and search for your measure, such as renewable.
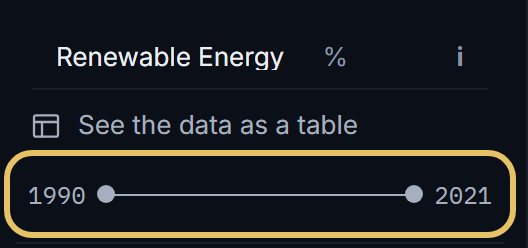
Drag the year range to the years you want to compare.
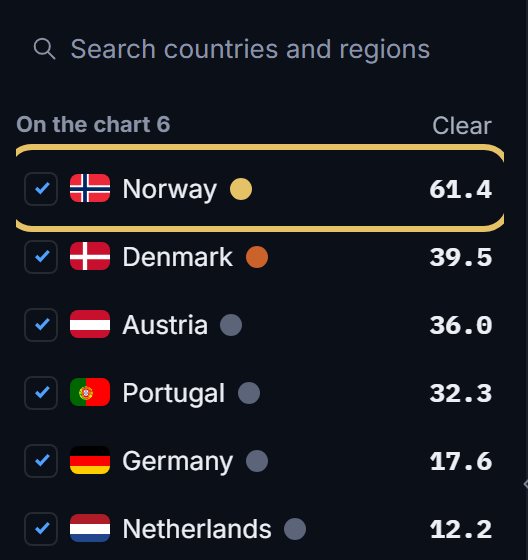
Tick the countries. Each one gets a panel, and the list shows its latest value.
Press Range beside the chart. Shared puts every panel on one scale, Free fits each panel to its own data.
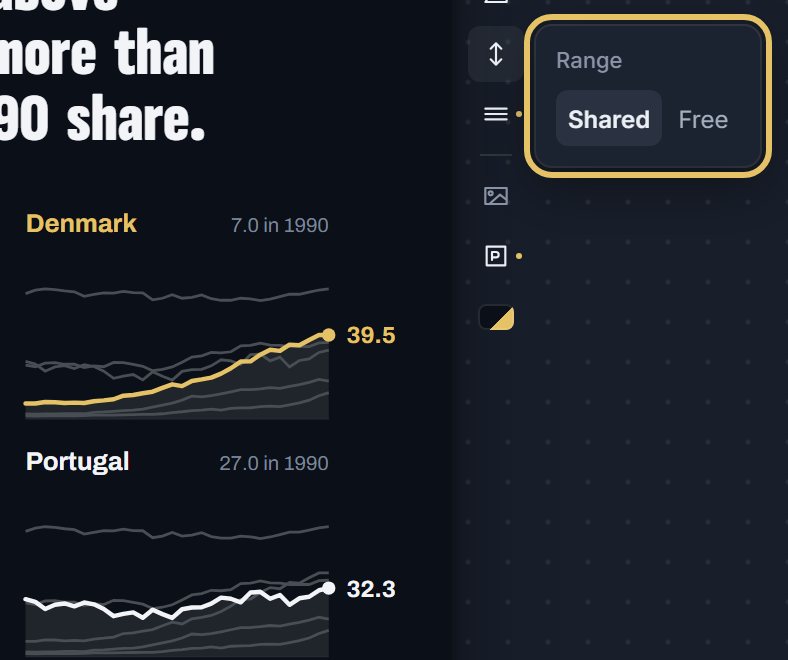
On a shared scale, Other countries draws the rest of the group faint behind each line. Press it to turn them off.
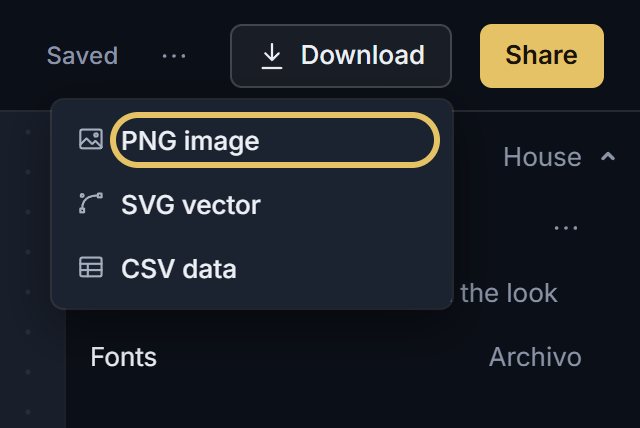
Open Download and choose PNG image. A free account downloads at 1x, PLUS at 2x and as SVG.
TipWrite a title that names the comparison, since no single panel can state it.
Should the panels share one y-axis?
Share it in most charts. Shared is the default: height means the same in every panel, so you compare levels.
Free compares shapes: when and how each country turned. It also makes a small change look as large as a big one, so say so in the subtitle.
On one scale, Niger's growth of more than 3% a year sits far above China and Japan, which have both turned negative.
Small multiples of annual population growth from 1990 to 2023, one panel each for Niger, India, China and Japan.
How GeoLens lays out the grid
The highlighted country comes first, by default the first in your list, then the rest by their latest value, highest first.
GeoLens picks the number of columns that gives each panel the most room in your frame. If the frame cannot fit every country at a readable size, the editor says how many it shows.
Already have a line chart? Open the shape menu above it and pick Small multiples.