How to add notes, lines and zones to a chart
Updated 9 Nov 20262 min read
To annotate a chart in GeoLens, pick a drawing tool beside the chart and click the plot. An info box puts a numbered note on a point, a horizontal line marks a level, and a zone shades a stretch of years or values.
What a good note looks like
Kenya's line passes Nigeria's in 2017 and keeps climbing. A note at the turn tells the reader why, so nobody has to guess.
The note sits on the point it explains. The chart marks the point with a number and prints the words under the plot, so the lines stay clear.
Line chart of the share of people with electricity in eight African countries, 2004 to 2024, with Kenya highlighted, rising to 77 percent.
How to annotate a chart, step by step
Five steps on the chart above. Each picture shows the control to use, ringed in gold.
The drawing tools sit left of the chart: Info box, Horizontal line, Zone and Event flag. Press one, then click the chart.

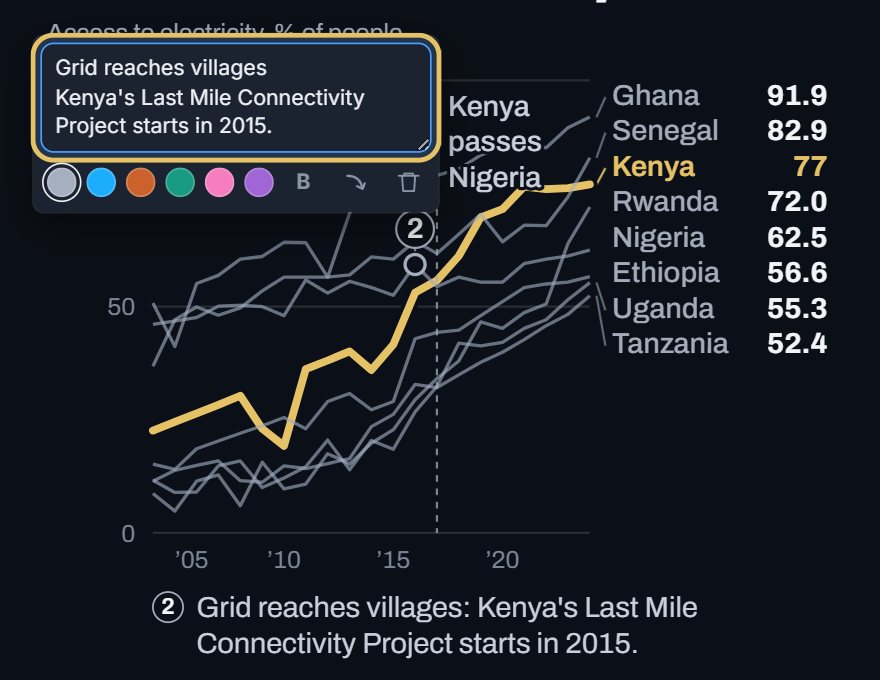
Press Info box and click a point on a line. Type a title on the first line and the note below it. The point gets a number, and the note prints under the plot.
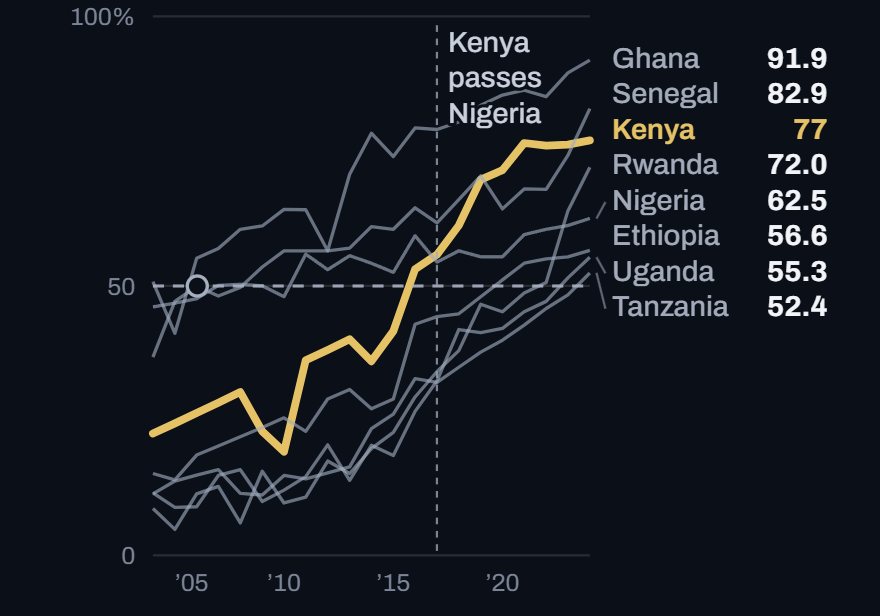
To mark a level, press the magnet so the mark stops snapping to the data, press Horizontal line and click the chart at the value, here 50 percent.
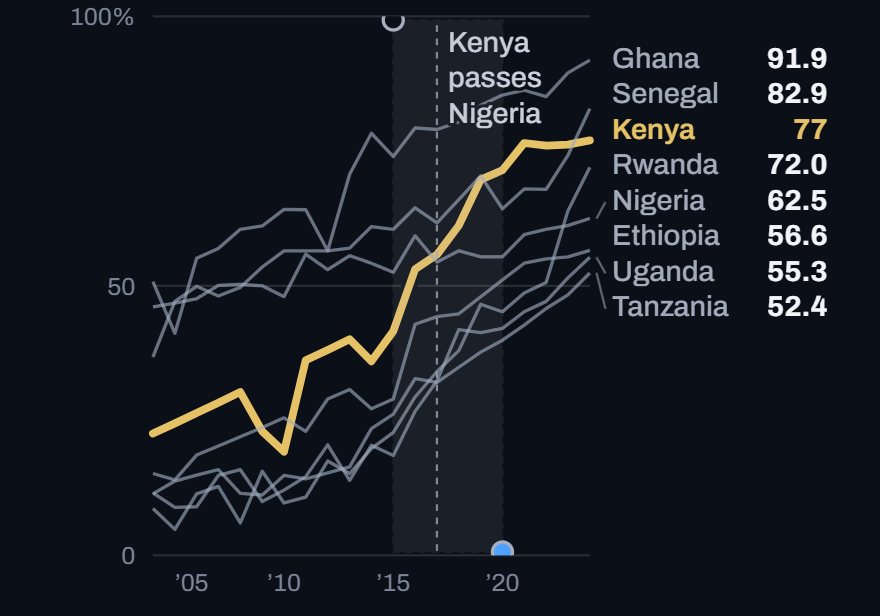
Press Zone and drag across the plot to shade a stretch of years, here 2015 to 2020.
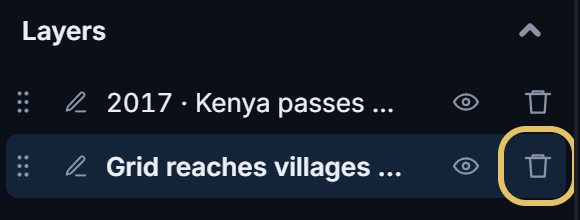
Every note, line and zone joins Layers on the right. The pencil renames it, the eye hides it, the bin removes it, and the handle drags it into a new order.
TipOne note on the turn the title talks about beats a note on every bump.
Which mark to use
Use an info box for a cause or an exception, a horizontal line for a target, an average or a threshold, and a zone for something that lasted years, such as a crisis or a programme.
For one year with a name, mark an event instead. It draws a rule at the year and needs no number.
Keep notes short
Write a short title and one sentence. A reader looks at a note for a second, then goes back to the line.
The bar under a note sets its colour, bold type and the leader to its point. Use the colour of the series it talks about, or grey.