How to change a chart's colours and fonts
Updated 8 Nov 20261 min read
Open the Design tab. Colours shows the colours of the current look, and clicking a line recolours that one series. Fonts offers pairs of display and text faces. Click any text on the chart to change its size, weight, colour and alignment.
Start from the look
Each look carries its own colours and fonts, and they are chosen to read well together. Change a look first, then adjust. Overriding many colours at once usually makes a chart harder to read.
How to change colours and fonts, step by step
Five steps. Each picture shows the control to use, ringed in gold.
In the Design tab, open Colours to see the accent, the ink and the muted colour of the look.
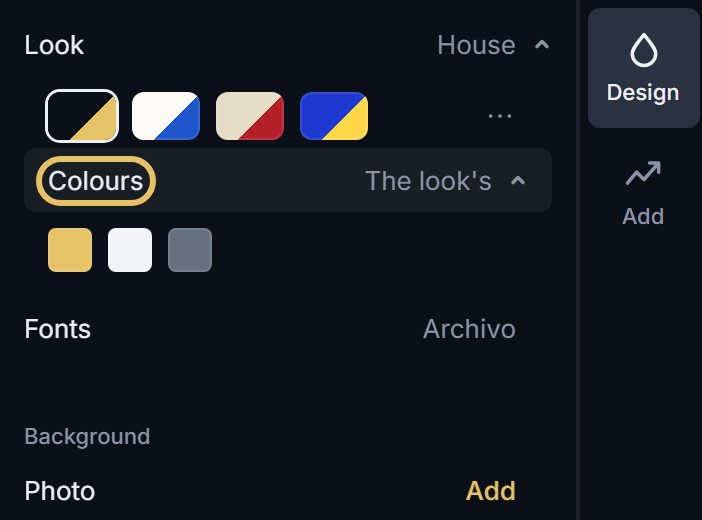
Click a line on the chart to open its colours. Choose one from the palette, or hide the series.

Open Fonts and choose a pair of display and text faces. The first is the look's own.
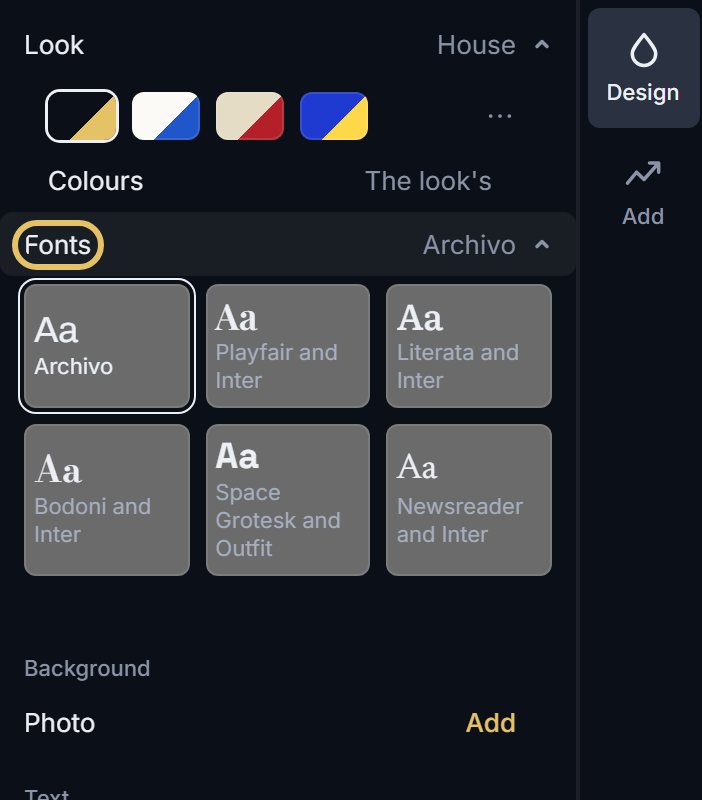
Click a piece of text on the chart. The bar above it sets the font, size, bold, italic, colour and alignment.

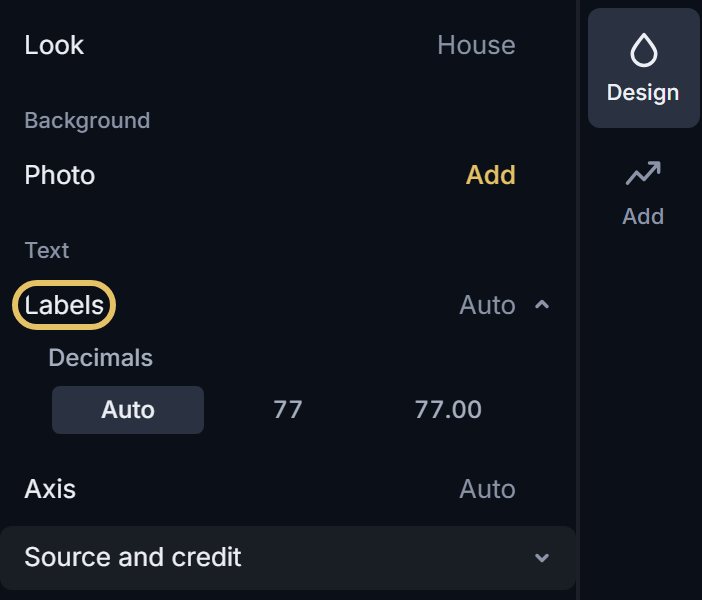
Under Text, open Labels to set how many decimals the value labels show: Auto, whole numbers or two decimals.
TipKeep to two fonts and one accent. Use colour to point, not to decorate.
What each plan takes
Every colour control is free. Free includes two font pairs, Playfair with Inter and Literata with Inter, besides the look's own. PLUS adds every font pair. PRO adds your own fonts, a font for each part of the chart, and brand kits.
Text colour and size
The A in the text bar sets the colour of the selected text, and the size field sets its size in pixels. Change one piece of text at a time: the title, the subtitle, the axis and the source line each have their own bar.
If you change many colours, check the whole chart again: every mark should still stand out from the ground.