How to make an animated line chart race
Updated 8 Nov 20262 min read
To make an animated line chart race, choose Line race in the GeoLens studio, pick an indicator, the years and 2 to 8 countries, then download the race as a video. Each line grows one year at a time, so viewers watch gaps open and close.
What a line chart race shows
The lines start in the first year and grow one year at a time. Nothing is thrown away, so the last frame reads as an ordinary line chart.
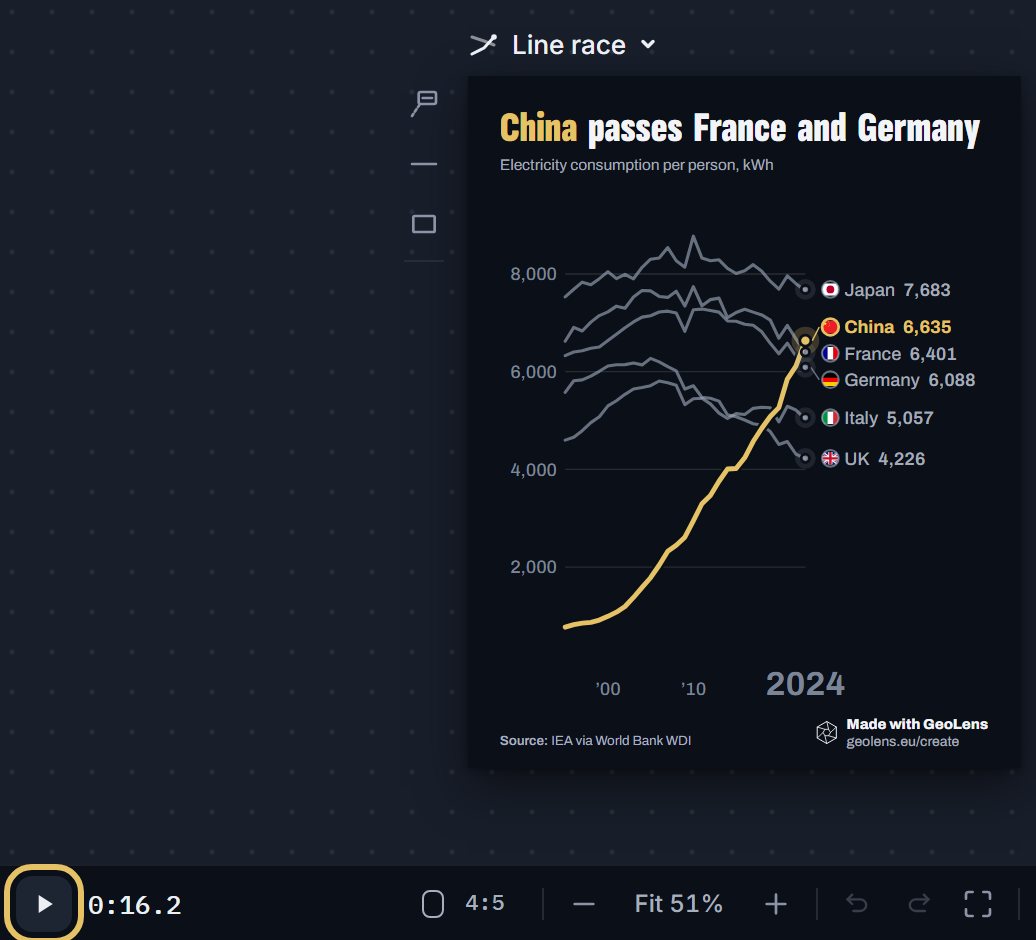
This race follows electricity use per person in six countries from 1995 to 2024. China starts at 770 kWh and reaches 7,038 kWh, passing the UK, Italy, Germany and France. Japan still ends highest, at 7,781 kWh.
Line chart race of electricity use per person in China, Japan, France, Germany, Italy and the United Kingdom from 1995 to 2024, China highlighted.
How to make a line chart race, step by step
Eight steps, from an empty studio to the video file. Each picture shows the control to use, ringed in gold.
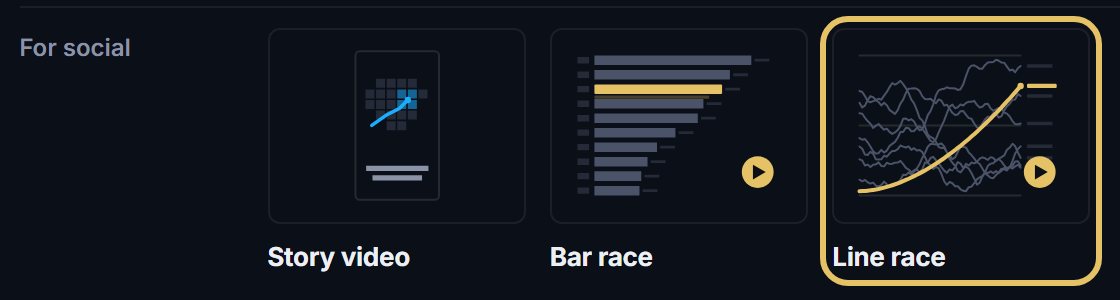
Open geolens.eu/create and choose Line race, under For social.
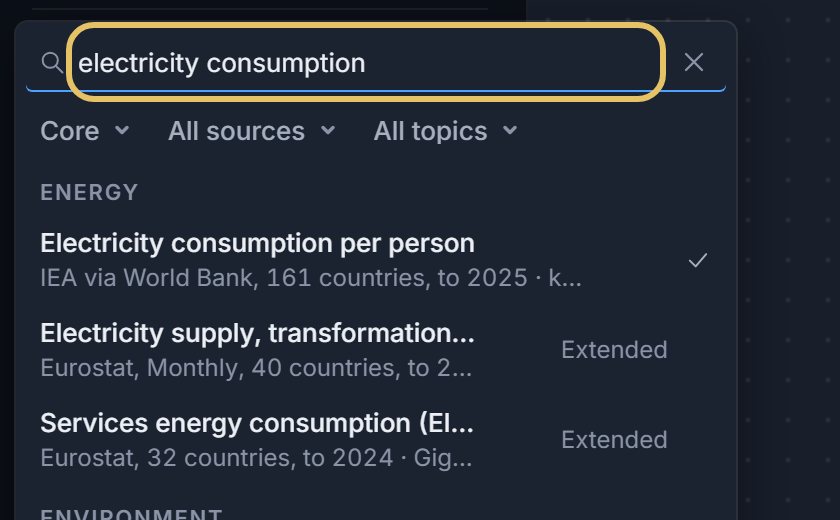
Press the indicator name at the top left and search for your measure, such as electricity consumption.
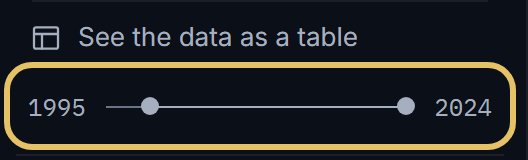
Drag the year range so the race starts shortly before the change you want to show.
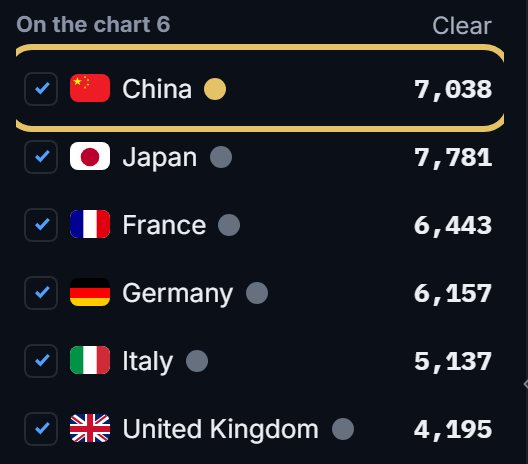
Tick 2 to 8 countries. The first in the list wears the highlight, so drag your story’s country to the top.
Move the playhead to the year that matters, press + on the Text track and write one line. It shows as the race passes that year.

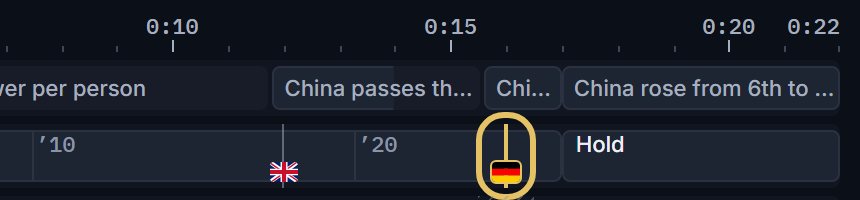
Check the race lane: GeoLens flags each pass. Select a flag to put the music’s drop on that pass.
Press Play and watch the whole race once. Check that every pass and every line of text reads at full speed.
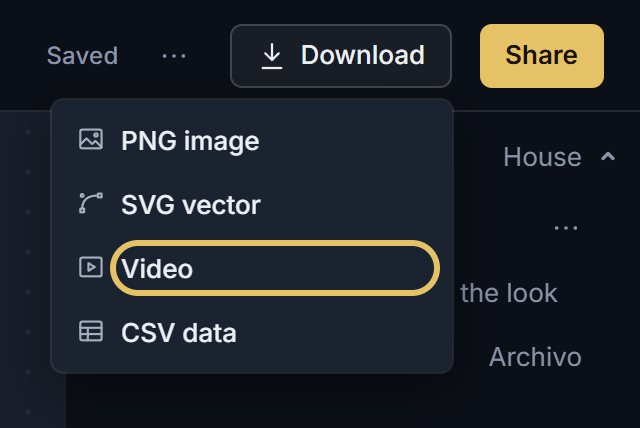
Open Download and choose Video for the MP4. Video download comes with PLUS.
TipEnd on the latest year every country has, so no line stops short of the others.
Pick data where the lines can meet
Use values per person, shares or an index. On totals the biggest countries sit far above the rest, the lines never cross and the race has nothing to show.
Keep one highlight colour and quiet colours for the rest. Each line carries its flag, name and value at its head, so the race needs no legend.
When another form is better
If two countries are the whole story, tick only those two and choose Duel in the shape menu above the chart. It shows the gap between them and the year they cross.
If only the order matters, choose Bar race in the same menu.
For a web page or a report, choose Line: a still chart lets readers compare values at their own pace.