What missing data looks like on a GeoLens chart
Updated 8 Nov 20261 min read
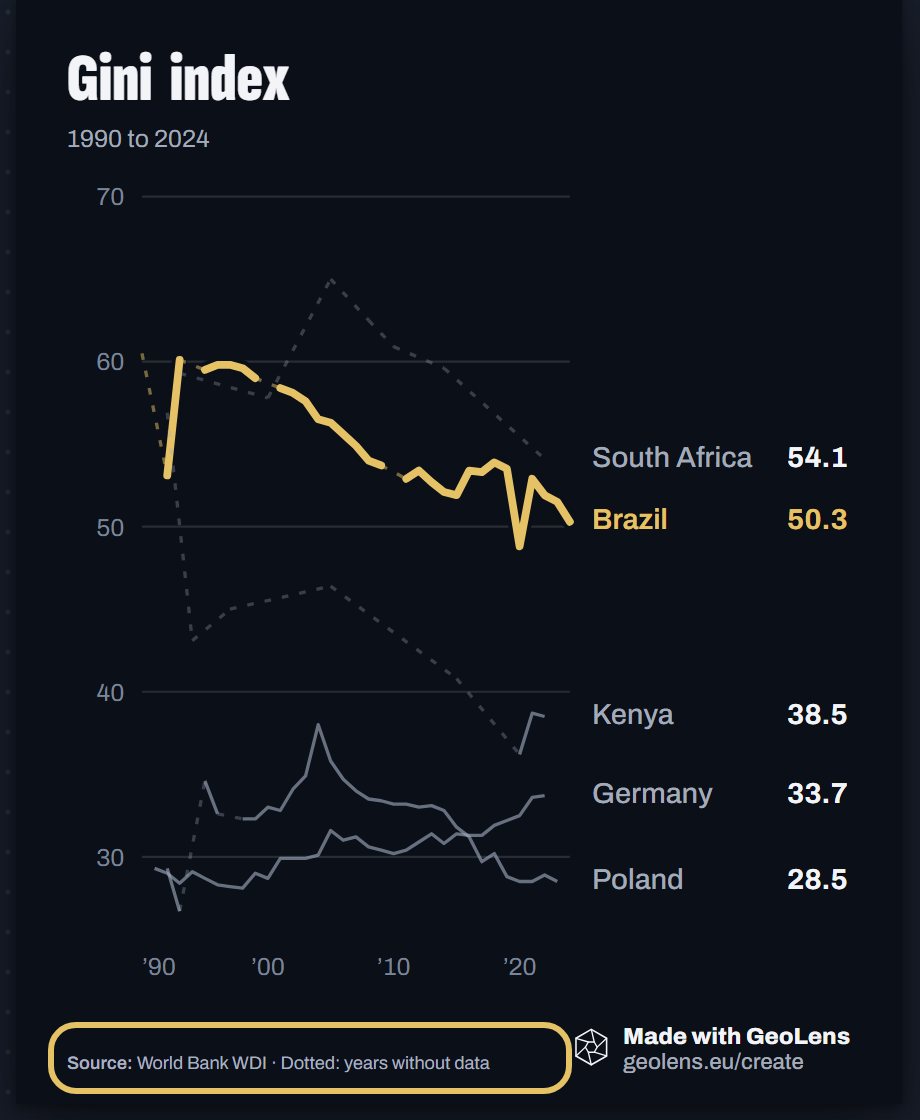
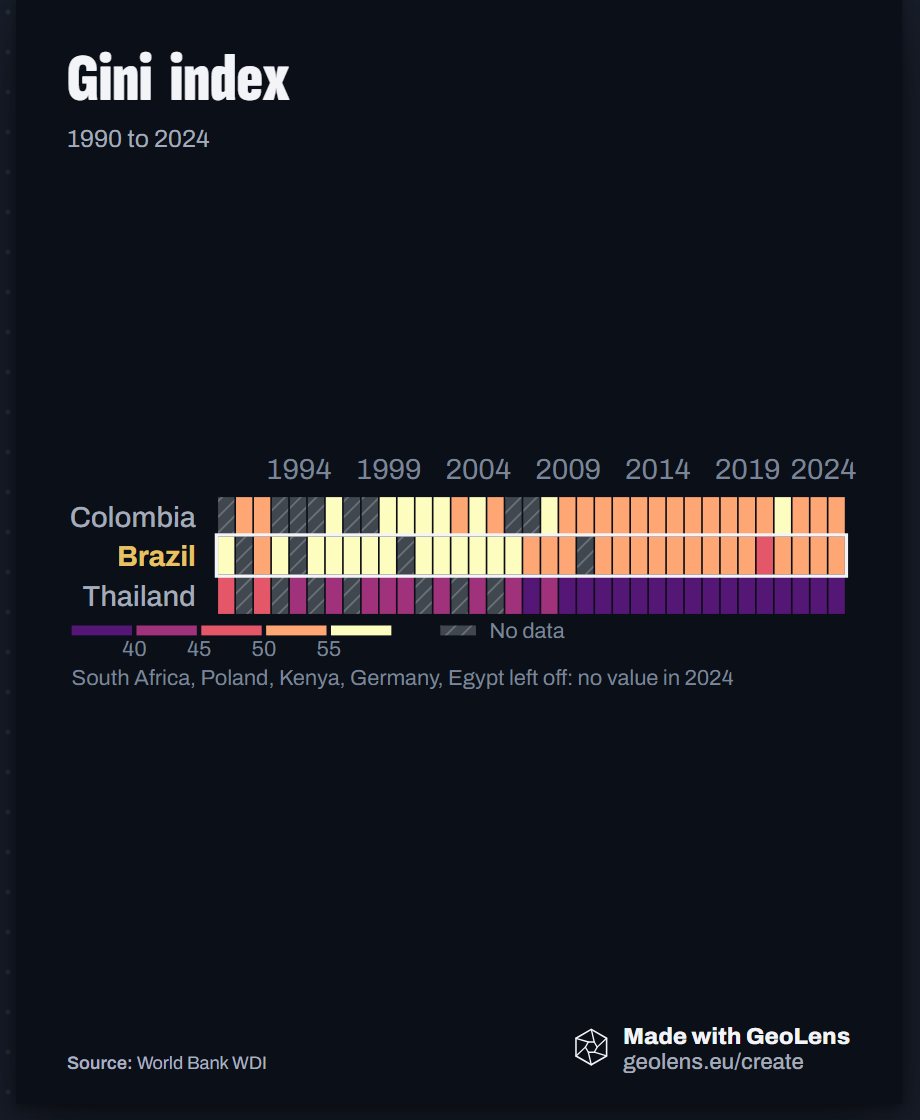
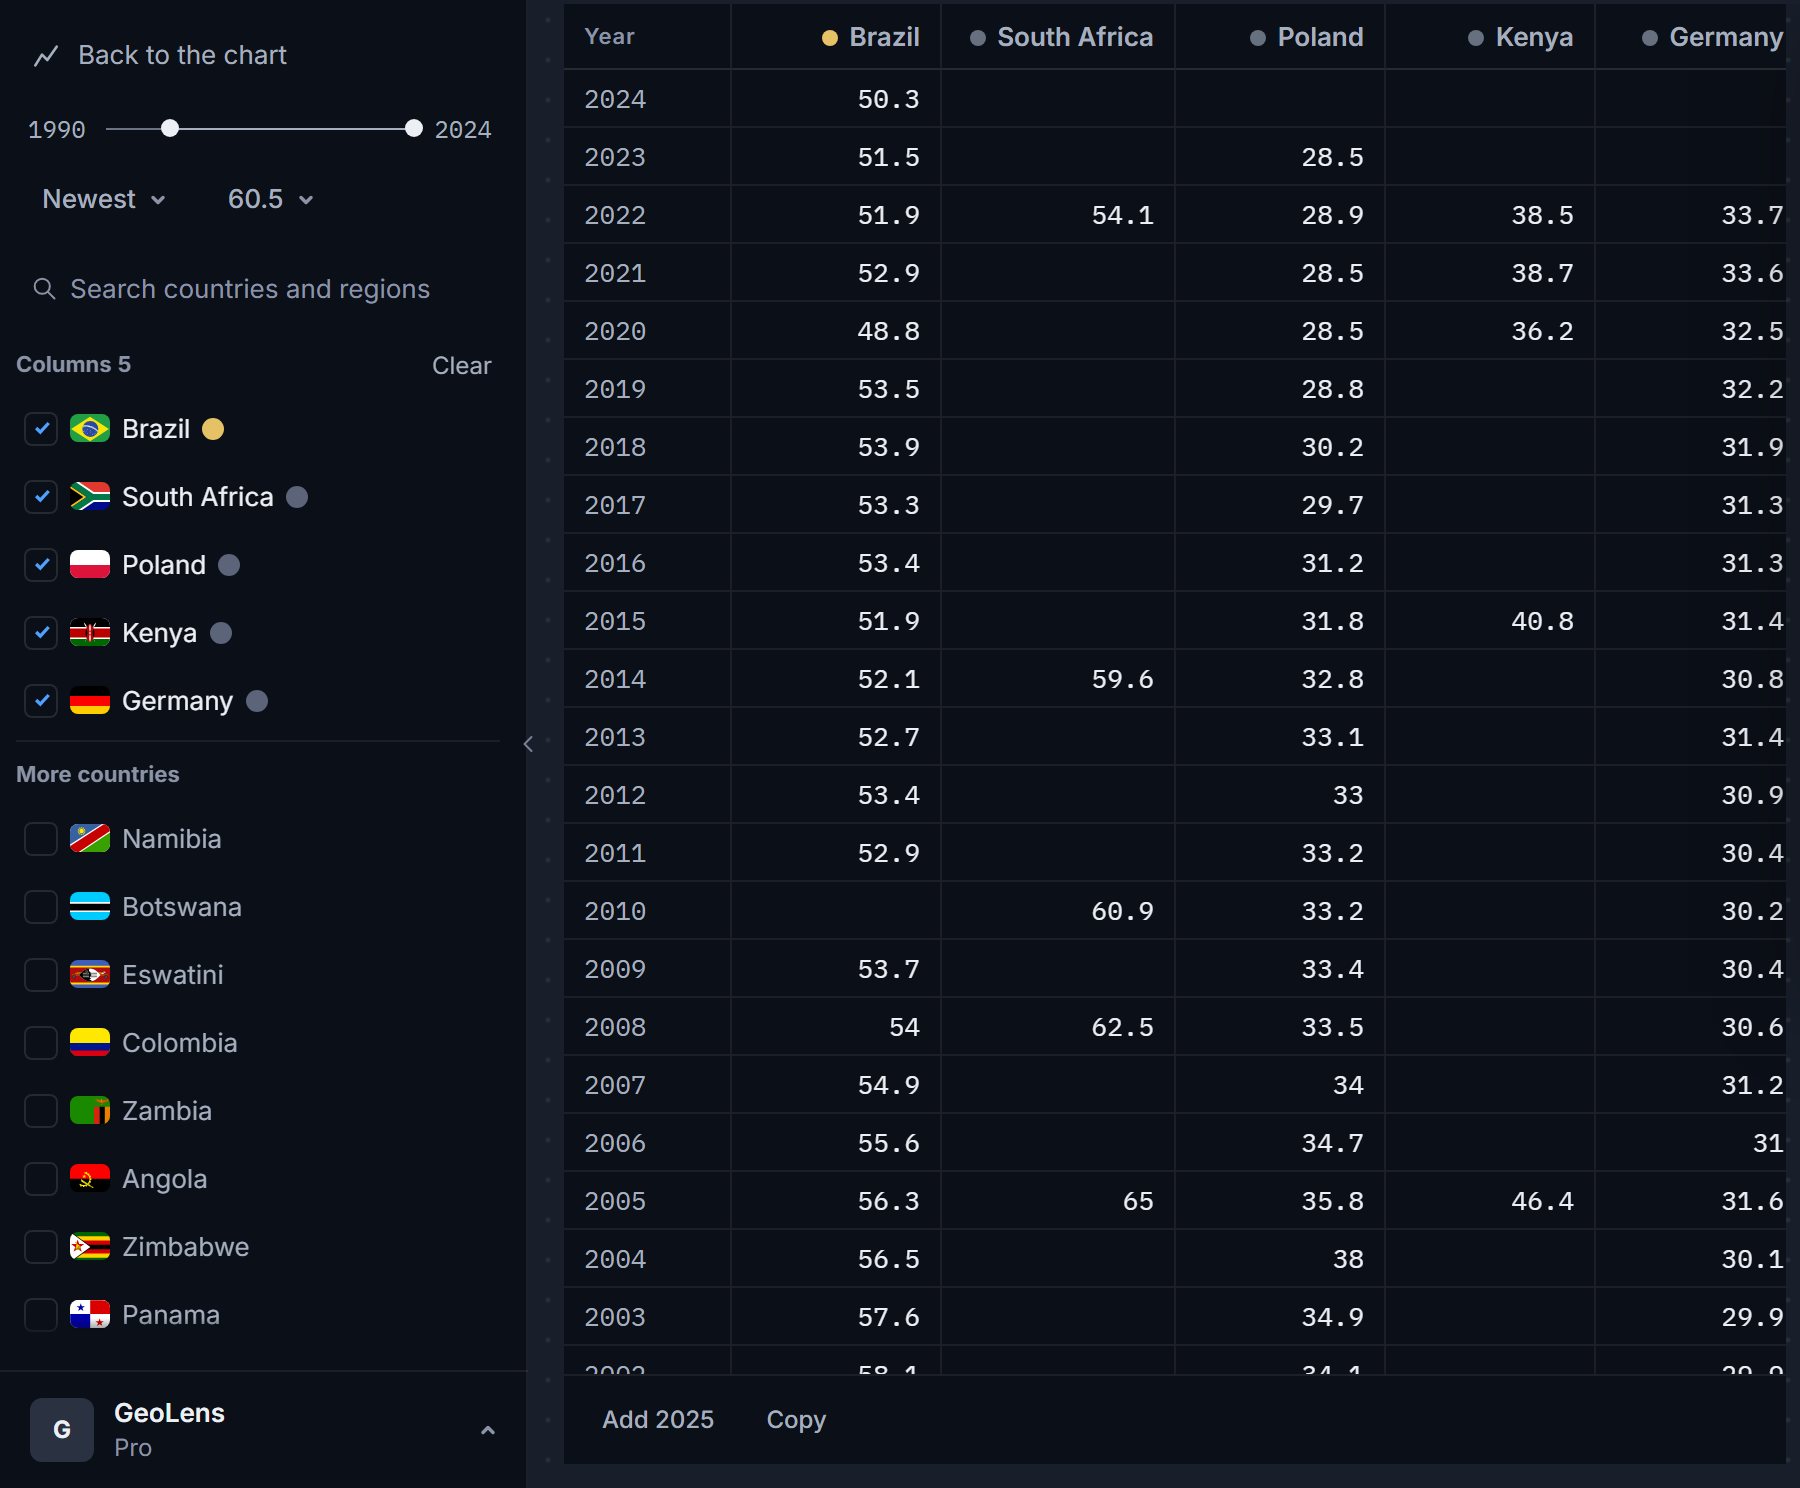
GeoLens never fills a gap with an invented number. A line draws dotted across years without data and says so under the chart. A heatmap hatches the empty cells. The data table prints a dash, and a country with no data for the indicator is marked No data.
Why country data has gaps
Surveys run every few years, and some countries do not report at all. Inequality, poverty and schooling series are the usual cases. A chart that hid the gaps would claim a certainty the data does not have.
Where a gap shows, step by step
Five places, on a chart of the Gini index. Each picture shows the sign to look for, ringed in gold.
On a line chart a dotted stroke joins the known points across years without data. The source line says Dotted: years without data, and hovering the stroke names the years.
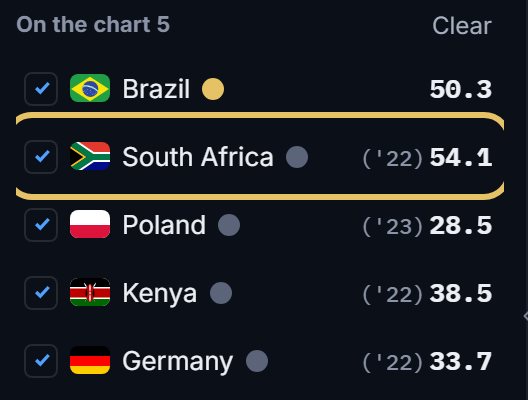
In the country list, a short year such as '22 beside a value means the latest value is older than the end of your range.
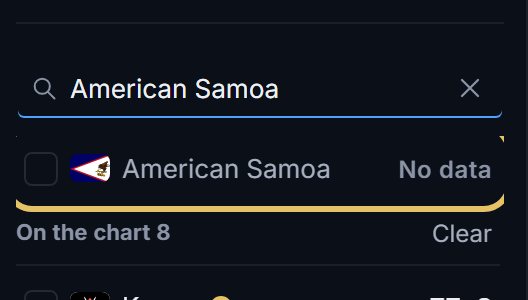
Search a country with nothing for the indicator and its row says No data.
A heatmap hatches the empty cells and keys them as No data. Countries with no value in the last year are left off, and a note names them.
The data table prints a dash for a missing value. A dash is never a zero.
TipSay it in the subtitle when the gaps matter, for example: survey years only.
What to do about a gap
Pick the years or countries that have data: a shorter range with fewer gaps often tells the cleaner story. Keep the dotted line when the trend is the point, and write one plain line in Source and credit about the missing years.
On a bar chart of one year, countries with no value for that year are named in a quiet note under the chart.
When to use something else
If most of the series is dotted, a line is the wrong shape. Try bars for the years you have, or a dumbbell between two years that both hold values.