How to make your first chart in GeoLens
Updated 8 Nov 20262 min read
Open geolens.eu/create and choose Line. Then pick an indicator, the years and the countries, write a title that states the finding, and download a PNG. Your first chart takes about five minutes and needs no data file.
What you need before you start
An account and one question about countries, such as how access to electricity changed in Kenya. You do not need a file: every built-in indicator is free and already in the studio.
A line chart is the best first chart. It answers how something changed, and it shows the studio's whole path in one sitting.
Where things are in the studio
Left: what the chart says, which is the indicator, the years and the countries. Middle: the chart itself, exactly as it will be exported. Right: how it looks, in two tabs, Design and Add. Download and Share sit at the top right.
Everything you change shows in the chart at once, and the studio saves as you go.
How to make a chart, step by step
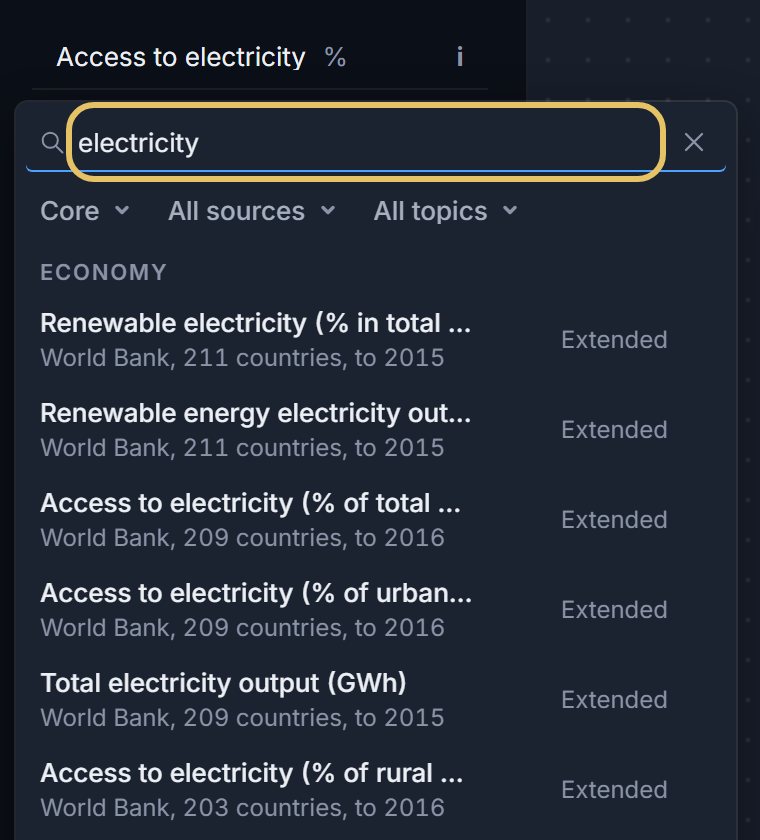
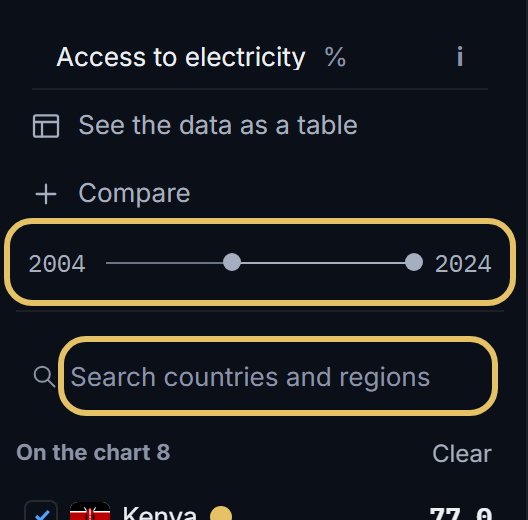
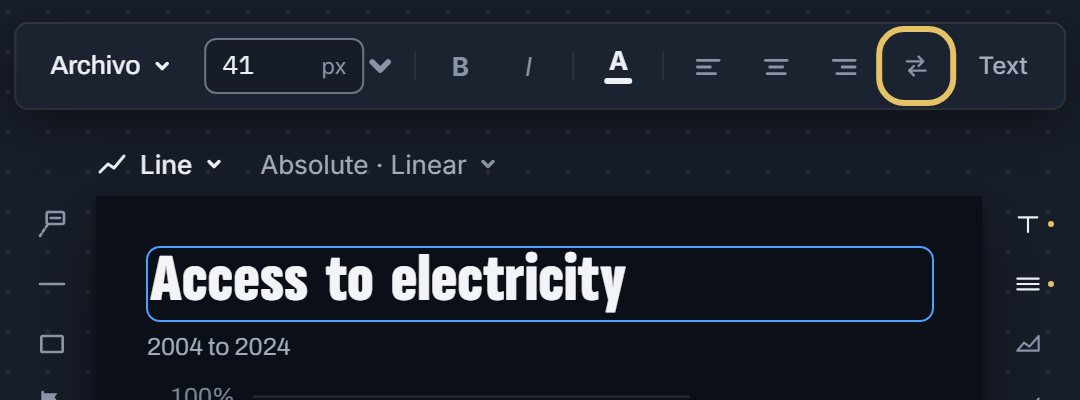
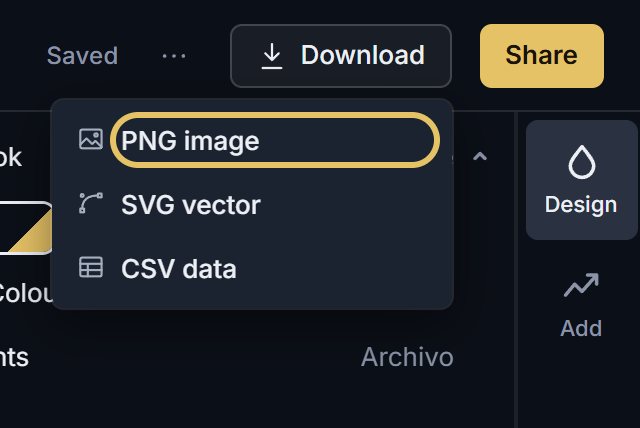
Six steps. Each picture shows the control to use, ringed in gold.
Open geolens.eu/create and choose a type. Line sits under Over time.
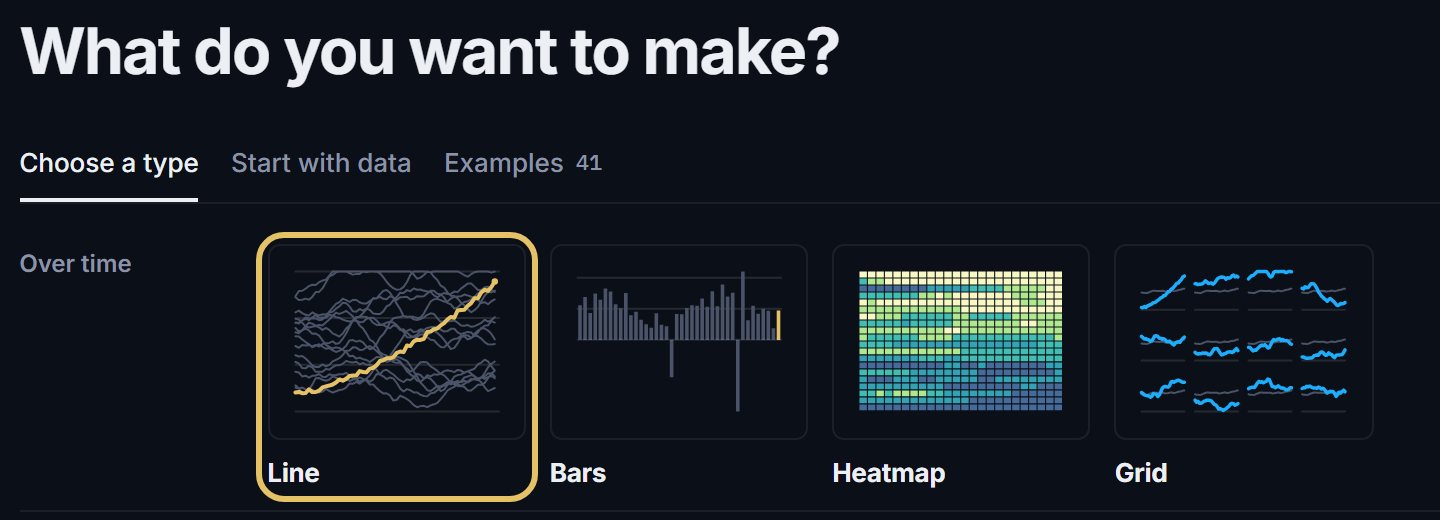
The chart opens straight away as a draft. To rename it, click its name in the bar.

Press the indicator name at the top left and search by name, such as electricity. Pick one result.
Set the start and end year, then search and tick the countries. The first country you pick is the highlighted one.
Click the title on the chart and press Use the finding as the title. Edit the words if you can say it better.
Open Download and choose PNG image. The file is the chart as you see it.
TipChange one thing at a time and look at the chart after each. The picture always shows what you will get.
What to do after the first chart
Press Share to give the chart a link or an embed, and keep working on it from My work. The studio saves as you go.
Try another shape from the shape menu above the chart: the same data redraws as bars, a heatmap or a map.
When to start somewhere else
Start from an example when you want to see a finished chart first: the Examples tab opens one in the studio. Start with data when you have your own table to chart.
Reorder and refine
Drag a country in the list to reorder the chart's legend. The first country stays the highlighted one. Undo and Redo, beside the zoom under the chart, take back any change.