How to make a bar chart race from country data
Updated 8 Nov 20262 min read
To make a bar chart race, choose Bar race in the GeoLens studio, pick an indicator and the countries, set the years and download the race as a video. It works when the order really changes, so pick a comparable measure.
What a bar chart race shows
Each frame is a bar chart for one year, sorted from highest to lowest. The bars swap places as the years run, so the viewer watches the order change.
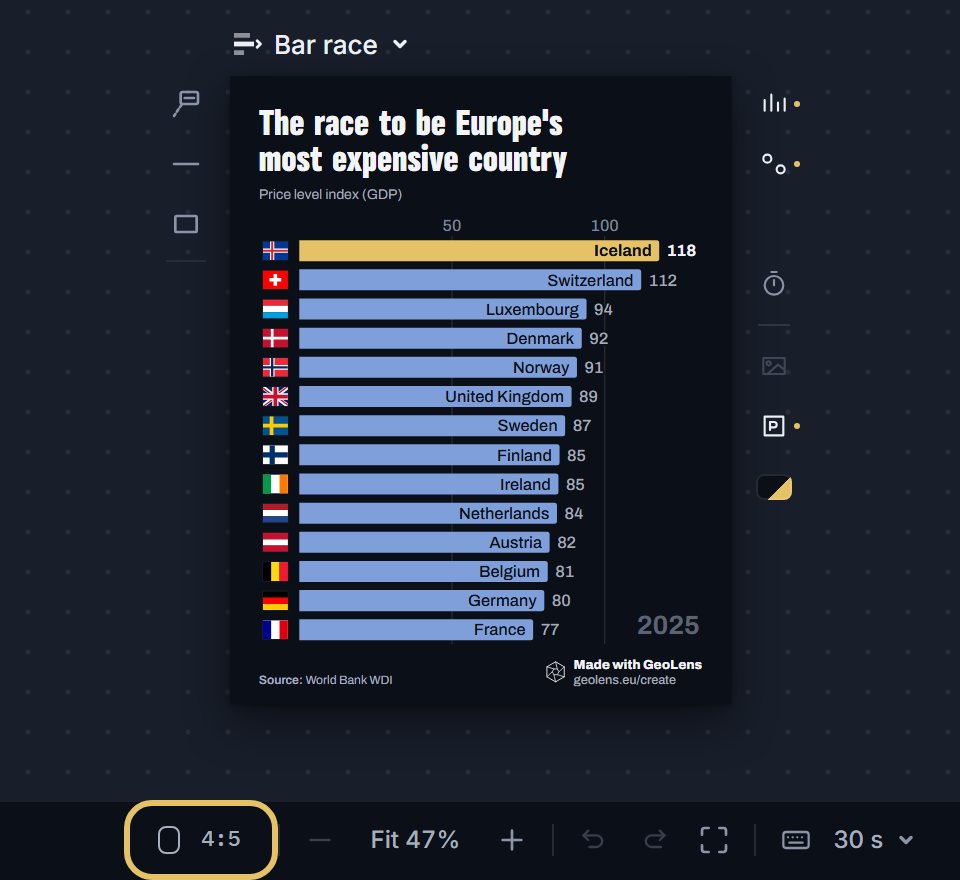
This race follows price levels in 14 Western European countries, with the US at 100. Iceland is first in 2007, last in 2009 and first again in 2025.
Bar chart race of price levels in 14 Western European countries, US = 100, 1995 to 2025, with Iceland highlighted.
How to make a bar chart race, step by step
Eight steps, from an empty studio to the video file. Each picture shows the control to use, ringed in gold.
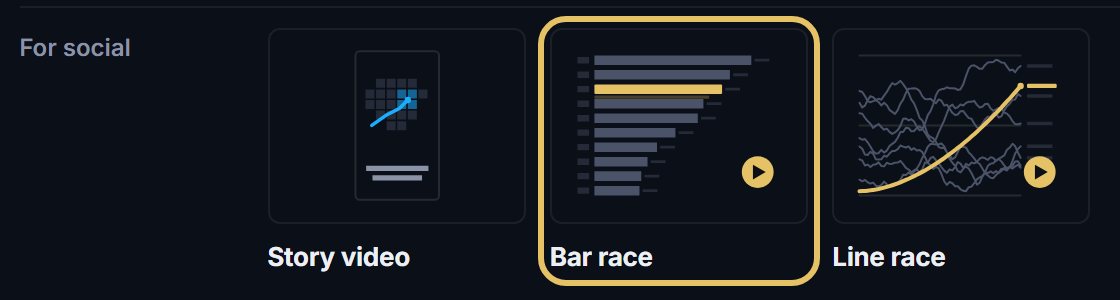
Open geolens.eu/create and choose Bar race, under For social.
The chart opens straight away as a draft. To rename it, click its name in the bar.

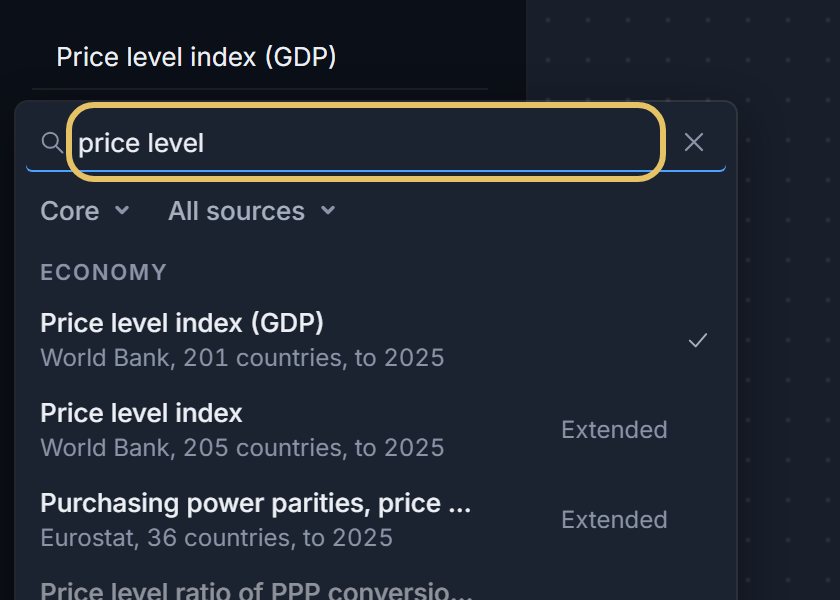
Press the indicator name at the top left and search for your measure, such as price level.
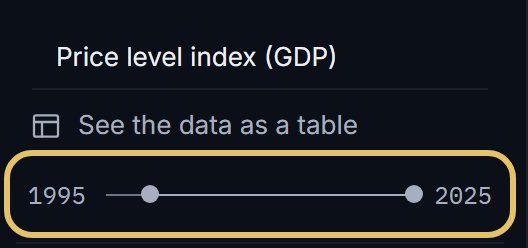
Drag the year range so the race starts where your story starts.
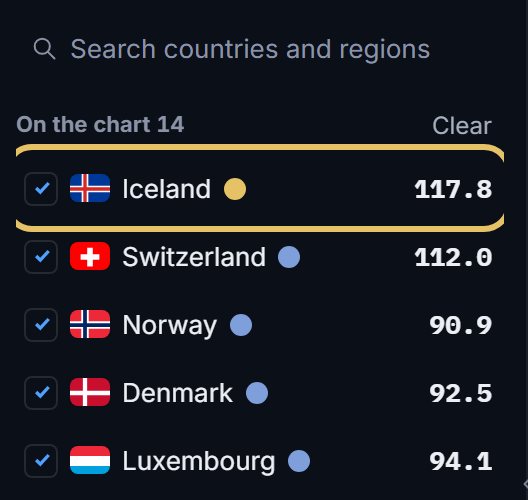
Tick the countries that race. The first in the list wears the highlight, so drag your story’s country to the top.
Write the captions on the text track. Each one shows while the race passes its moment.

Press the frame button under the chart to change its shape, from the 4:5 post to a wide link card.
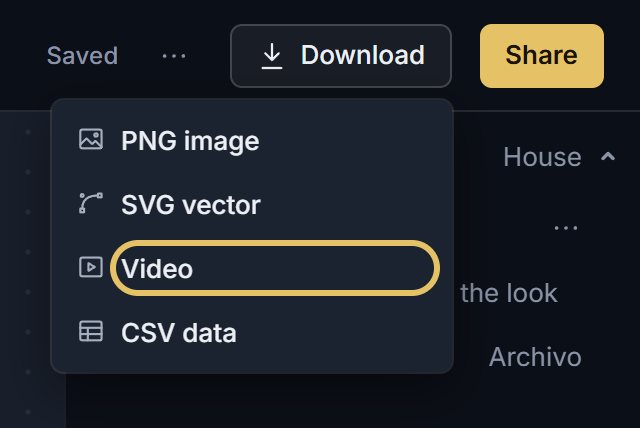
Open Download and choose Video for the MP4. Video download comes with PLUS.
TipCheck that every country has a value in every year, or its bar will vanish and jump.
Pick data that makes a good race
Use values per person, shares or an index. Totals let the biggest countries lead every year, and a race with no overtakes has no story.
Keep the field small enough to read on a phone. With a long list, the race shows the top 10, 12, 20 or 30.
When another chart is better
If one country leads from start to finish, show the gap on a line chart.
If the path matters as much as the order, use a line race. For a page people read rather than a feed, a bump chart shows the whole ranking in one still image.