How to make a scatter plot of two country indicators
Updated 8 Nov 20262 min read
To make a scatter plot of two country indicators, choose Scatter in the GeoLens studio, pick the measure that runs across and the one that runs up, set one year and tick the countries. Each dot is one country, so the outliers stand out.
What a scatter plot of two indicators shows
Each dot is a country, placed by two values for the same year. A slope across the dots says the measures move together; a dot far from the rest is the story.
Here life expectancy runs across and health spending as a percentage of GDP runs up, for 2023. The United States sits highest, at 16.7% of its economy, yet lived 4.8 years less than Israel, which spent 7.1%.
Scatter plot of countries in 2023, life expectancy across and health spending as a percentage of GDP up, with the United States highest and Israel low and to the right.
How to make a scatter plot, step by step
Eight steps, from an empty studio to the image file. Each picture shows the control to use, ringed in gold.
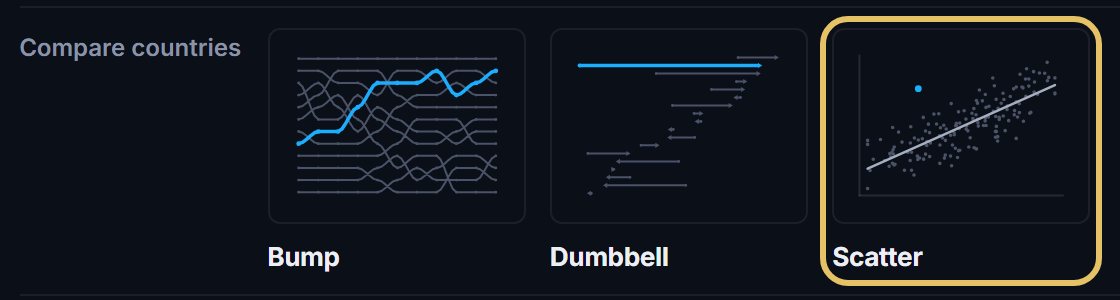
Open geolens.eu/create and choose Scatter, under Compare countries.
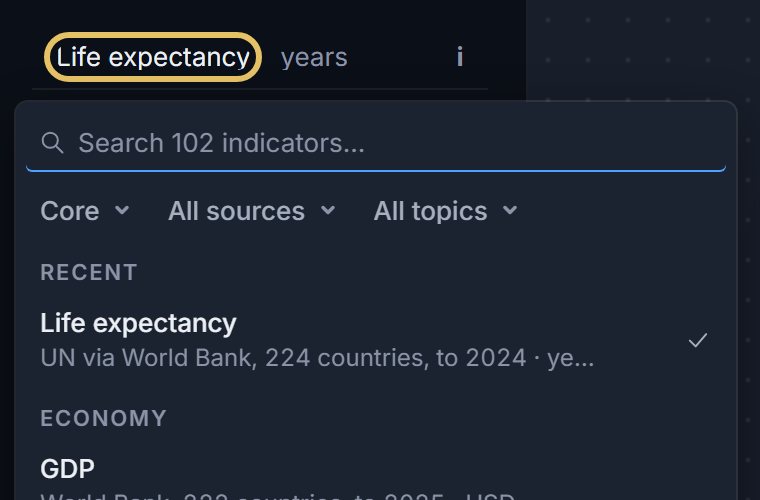
Press the indicator name at the top left and pick the measure that runs across, such as life expectancy.
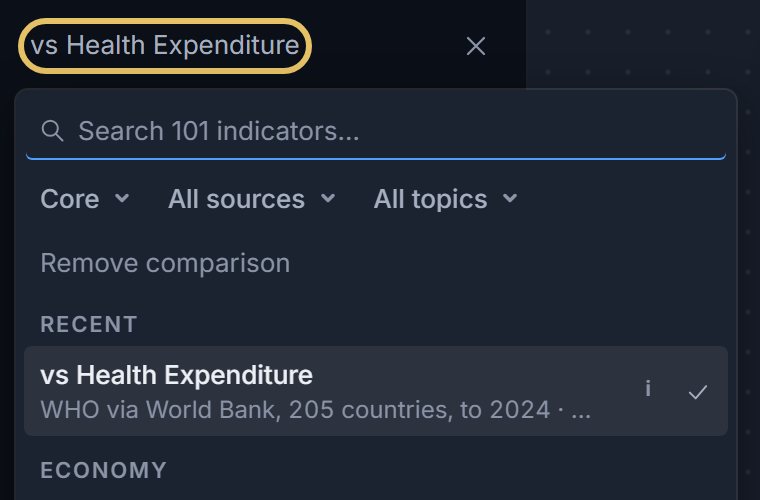
Press the vs line under it and pick the measure that runs up, such as health spending.
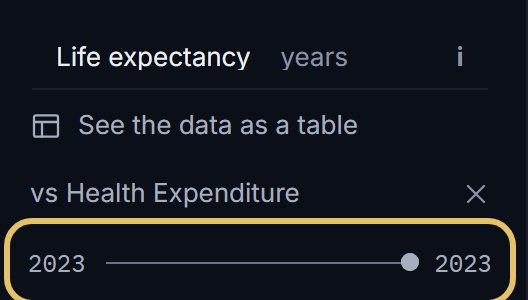
Drag both ends of the year slider to the same year, so every dot shows one moment.
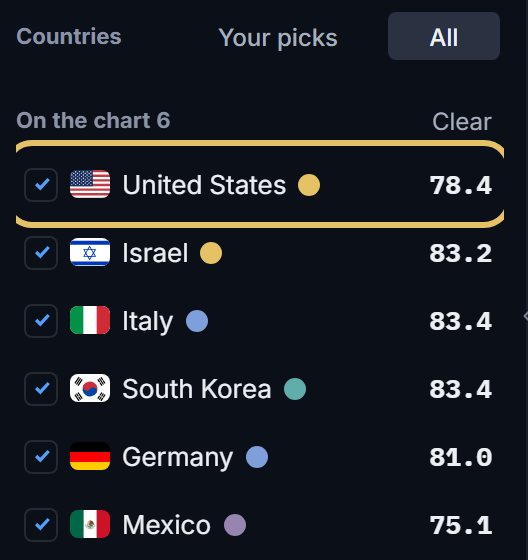
Tick the countries you want to name. The first in the list wears the gold, and so does a pick your title names, so drag your story's country to the top.
Press Names, the first switch beside the chart, to label the extremes or the countries you choose.

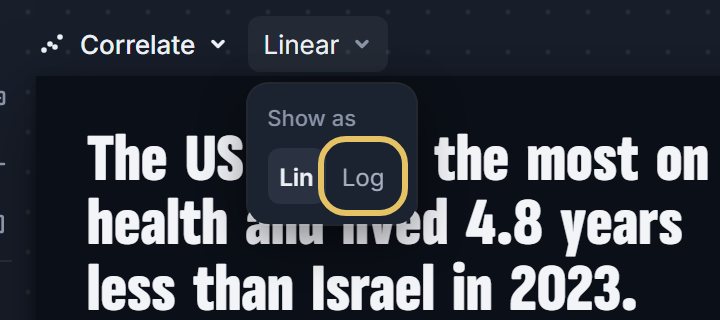
Open the menu beside Scatter and choose Log when the values across span a wide range, such as GDP per person.
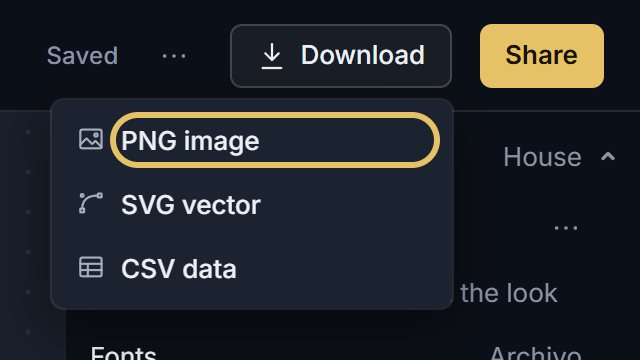
Open Download and choose PNG image. A free account is enough; SVG comes with PLUS.
TipUse rates and shares, not totals, or the biggest countries sit in the far corner just for being big.
Pick two indicators that belong together
Choose a pair with a reason to be related: spending and an outcome, income and emissions, schooling and earnings.
The two can come from different publishers: the chart prints both sources.
What a scatter plot cannot prove
Dots that move together do not show that one measure causes the other. A third factor, such as income or age, can drive both.
Write the title about what the dots show, a gap or an outlier, as this example does.
Six countries make a comparison. For a general pattern, switch Countries to All, which draws every other country behind your picks, and turn on Trend. It draws a fitted line only when the dots really line up, and never for fewer than eight.