Only Luxembourg in the EU emits more CO2 per head than China
Chart · 1 Nov 2026
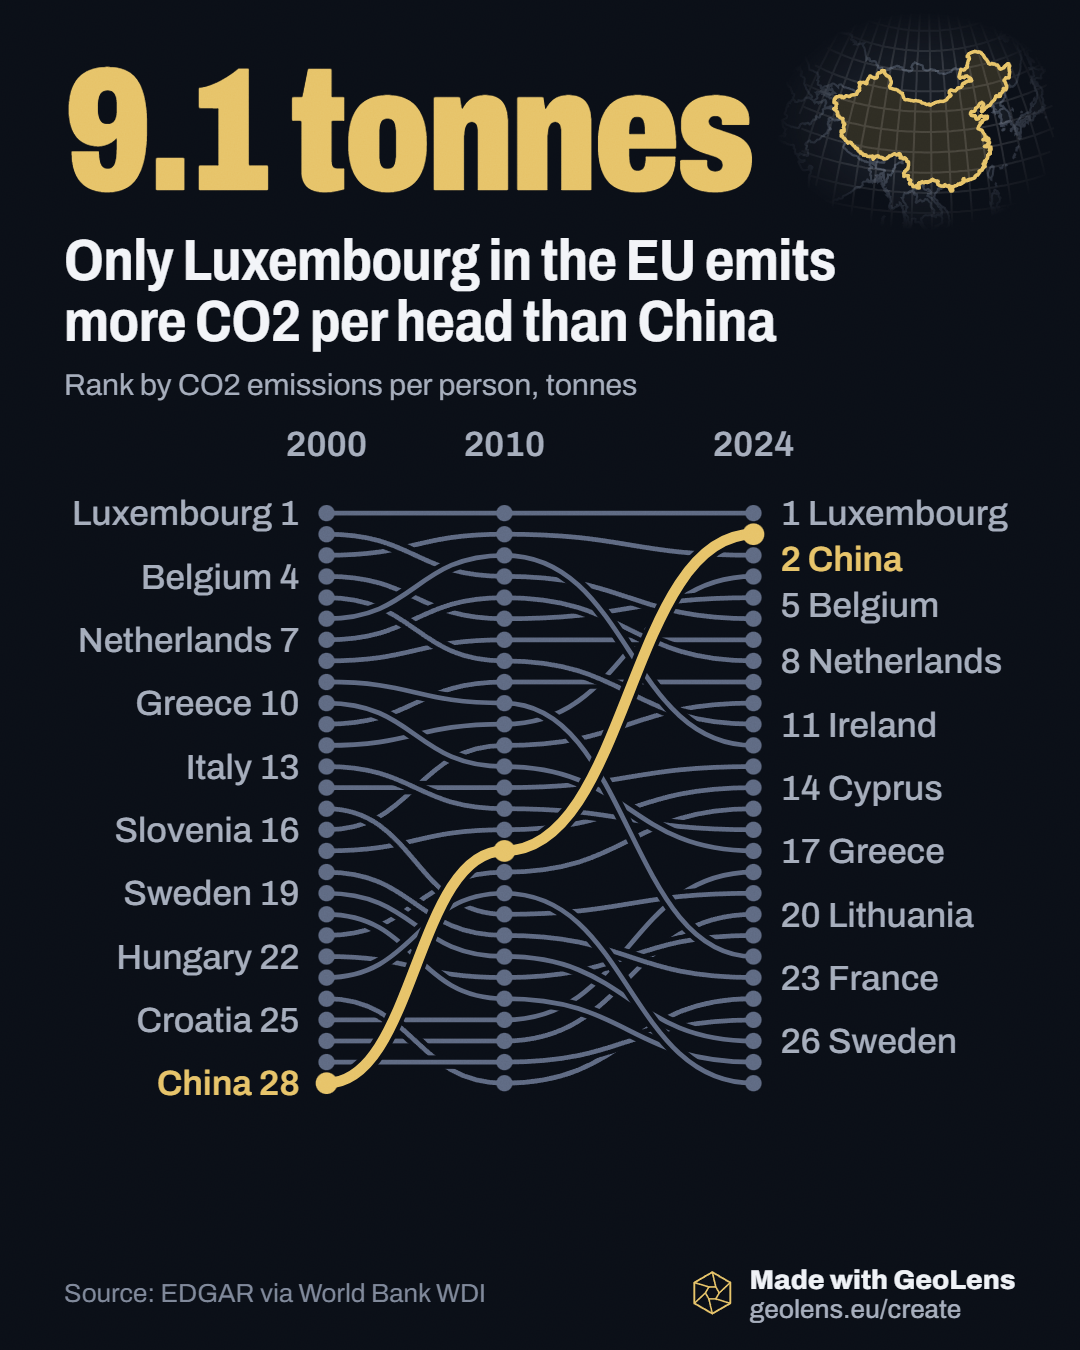
China's emissions per person reached 9.1 tonnes of CO2 in 2025, more than 26 of the EU's 27 members.
Only Luxembourg, at 9.7 tonnes, emits more per head.
Source: EDGAR (JRC), 2025.
What the chart shows
Luxembourg is highest in 2024 at 10.6 t per person, Malta lowest at 3.2 t per person. 24 of the 28 countries fell and 4 rose. China moved the most, up 222%.
The numbers, t per person
| Country | 2000 | 2024 | Change (%) |
|---|---|---|---|
| Luxembourg | 20.2 | 10.6 | −48 |
| China | 2.9 | 9.3 | +222 |
| Estonia | 12.8 | 7.8 | −39 |
| Poland | 8.2 | 7.6 | −7.7 |
| Belgium | 12.2 | 7.3 | −40 |
| Czechia | 12.9 | 7.1 | −45 |
| Germany | 10.6 | 6.9 | −34 |
| Netherlands | 11.1 | 6.6 | −41 |
| Austria | 8.3 | 6.3 | −24 |
| Slovenia | 7.6 | 6.3 | −17 |
| Ireland | 11.5 | 6 | −48 |
| Finland | 11.1 | 5.5 | −50 |
| Slovakia | 7.7 | 5.5 | −29 |
| Cyprus | 7.5 | 5.4 | −28 |
| Bulgaria | 5.9 | 5.3 | −10.0 |
| Italy | 8 | 5.1 | −36 |
| Greece | 8.9 | 5 | −43 |
| Croatia | 4.3 | 4.8 | +11 |
| Spain | 7.6 | 4.5 | −41 |
| Lithuania | 3.3 | 4.5 | +35 |
| Hungary | 5.8 | 4.5 | −23 |
| Denmark | 10 | 4.3 | −57 |
| France | 6.6 | 4 | −39 |
| Romania | 4.3 | 3.7 | −14 |
| Latvia | 3.1 | 3.6 | +19 |
| Sweden | 6.5 | 3.6 | −45 |
| Portugal | 6.2 | 3.3 | −47 |
| Malta | 5.5 | 3.2 | −42 |
About the data
- Indicator
- Carbon dioxide (CO2) emissions excluding LULUCF per capita (t CO2e/capita)
- Unit
- t per person
- Source
- EDGAR via World Bank WDI
- Years in the data
- 1970 to 2024