Skip to content
GEOLENS
StoriesExploreDocsPricing
Create
Stories

China emits more than the next four countries combined

Chart · 10 Nov 2026
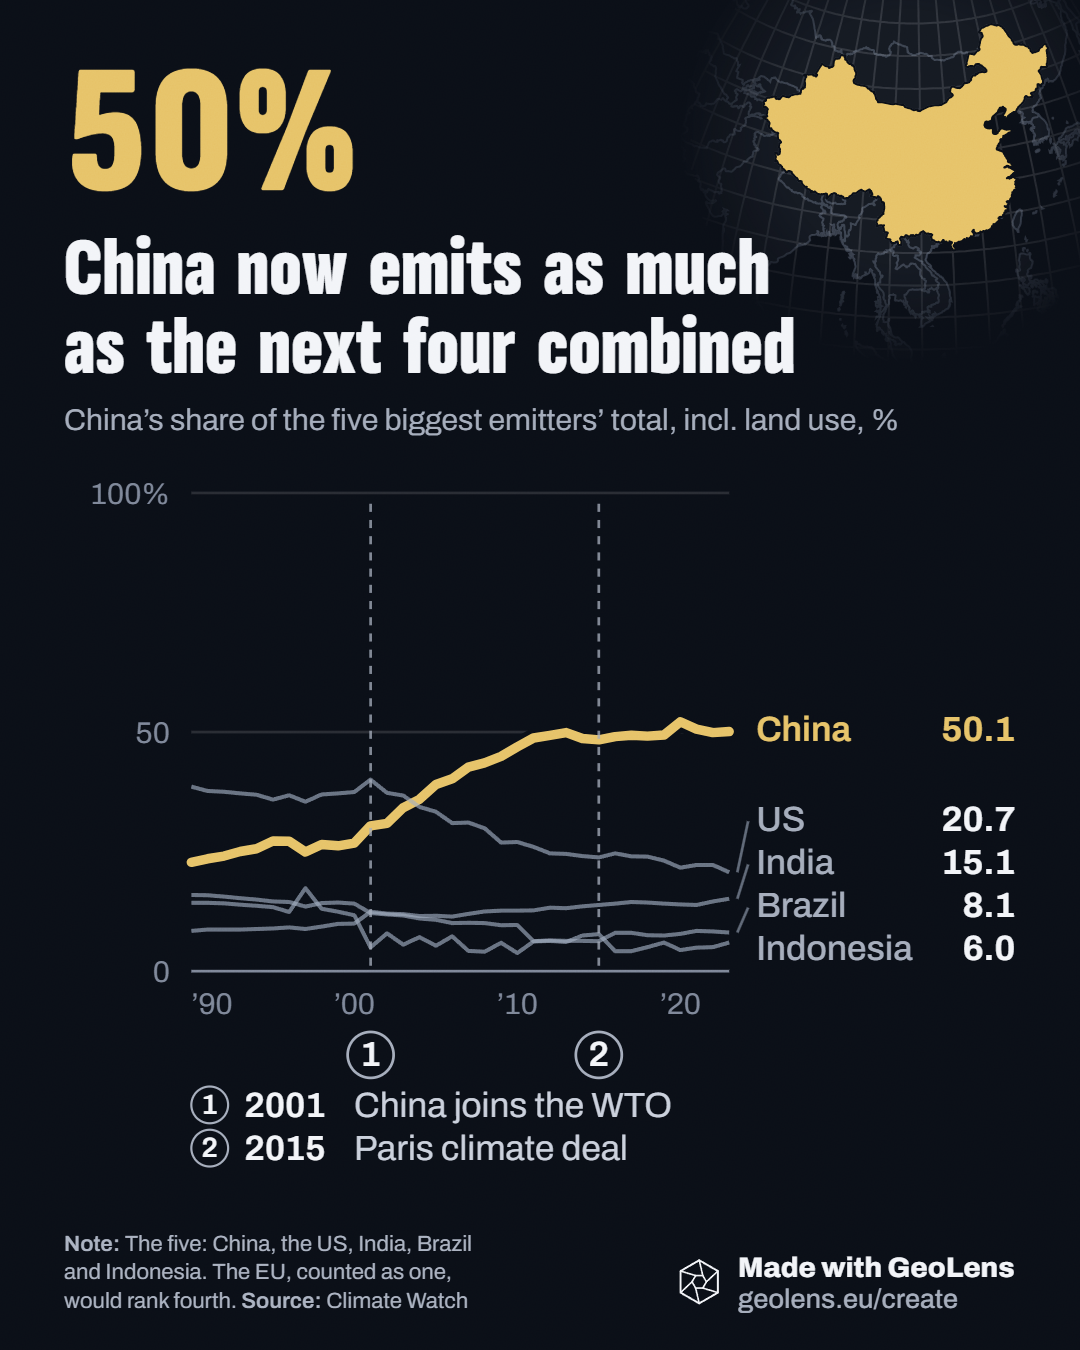
Line chart of China’s share of the greenhouse gas emitted by the five biggest emitters (China, the US, India, Brazil and Indonesia), incl. land use, 1990 to 2023. China, in gold, rises to 50.1%, as much as the other four combined; the US falls to 20.7%. Dashed lines mark 2001, China joins the WTO, and 2015, the Paris climate deal.

In 1990 China emitted 3.1bn tonnes of greenhouse gas, less than the US. In 2023 the next four emitters, the US, India, Brazil and Indonesia, added up to 13.1bn, still short of China.

Source: Climate Watch, 2023

Open this chart

Ran on Facebook, Bluesky, Threads, Instagram

More stories

Where babies are least likely to reach their first birthdayChartThe US still buys more from the world than ChinaChartGreece all but quit coal power in nine yearsChartNigeria is the least online of the eight most populousChartEurope's arms imports quadrupled in ten yearsChartThe US now emits more methane than IndiaChart
GEOLENS
Open the editor

Make

  • All chart types
  • Bar race videos
  • Line race videos

Learn

  • Guides
  • Make your first chart
  • Data stories

Data

  • Explore the world map
  • Country profiles
  • Data sources

GeoLens

  • Pricing
  • GeoLens vs other tools
  • © 2026 GeoLens
  • Privacy
  • Terms
  • Data from World Bank, IMF, Eurostat and Our World in Data
hello@geolens.eu