Bulgaria's population has fallen every year since 1990
Chart · 28 Oct 2026
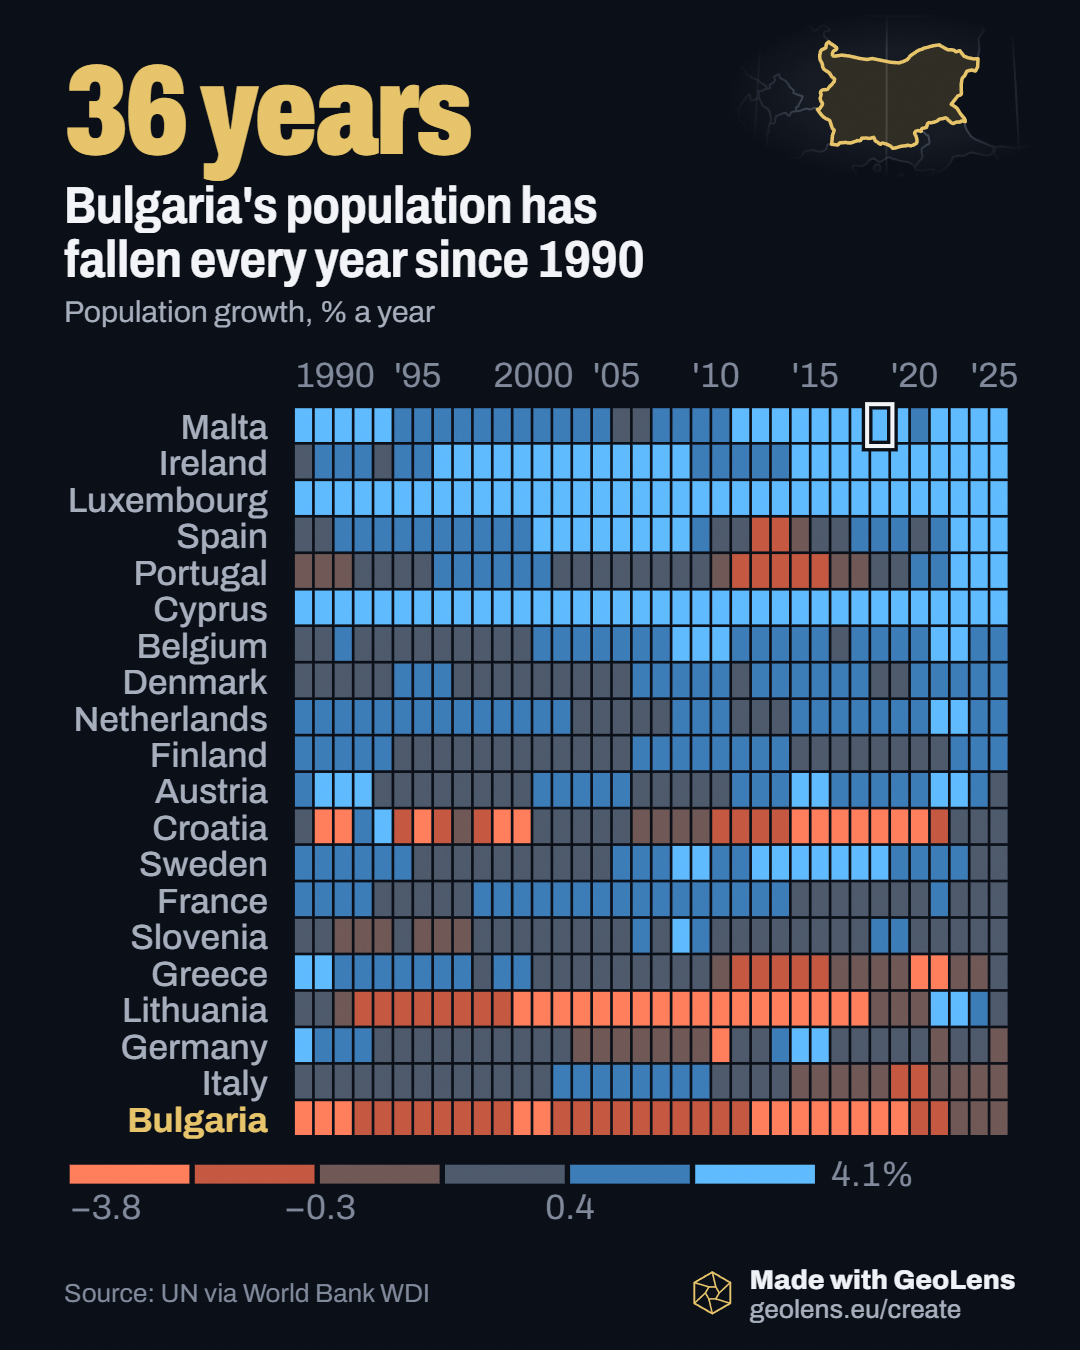
Every cell in Bulgaria's row is below zero. Its population has not grown once in 36 years.
What the chart shows
Malta is highest in 2025 at 1.9%, Latvia lowest at −1.0%. 14 of the 27 countries fell and 13 rose. Bulgaria moved the most, up 1.7 points.
The numbers, %
| Country | 1990 | 2025 | Change (points) |
|---|---|---|---|
| Malta | 1.0 | 1.9 | +0.9 |
| Ireland | 0.1 | 1.6 | +1.5 |
| Luxembourg | 1.3 | 1.5 | +0.2 |
| Spain | 0.1 | 1.0 | +0.9 |
| Portugal | −0.2 | 1.0 | +1.2 |
| Cyprus | 1.4 | 0.9 | −0.5 |
| Belgium | 0.3 | 0.7 | +0.4 |
| Denmark | 0.2 | 0.5 | +0.4 |
| Netherlands | 0.7 | 0.5 | −0.2 |
| Finland | 0.4 | 0.5 | 0 |
| Austria | 0.8 | 0.3 | −0.4 |
| Croatia | 0.2 | 0.3 | 0 |
| Sweden | 0.8 | 0.3 | −0.5 |
| France | 0.5 | 0.2 | −0.3 |
| Slovenia | 0.1 | 0.2 | +0.1 |
| Greece | 1.1 | 0.1 | −1.0 |
| Lithuania | 0.4 | 0.0 | −0.4 |
| Germany | 0.9 | 0.0 | −0.9 |
| Italy | 0.1 | −0.1 | −0.1 |
| Bulgaria | −1.8 | −0.1 | +1.7 |
| Slovakia | 0.4 | −0.2 | −0.6 |
| Romania | 0.2 | −0.2 | −0.3 |
| Czechia | −0.3 | −0.2 | +0.1 |
| Poland | 0.4 | −0.3 | −0.7 |
| Estonia | 0.1 | −0.4 | −0.5 |
| Hungary | −1.0 | −0.5 | +0.5 |
| Latvia | −0.1 | −1.0 | −0.8 |
About the data
- Indicator
- Population Growth
- Unit
- %
- Source
- UN via World Bank WDI
- Years in the data
- 1961 to 2025