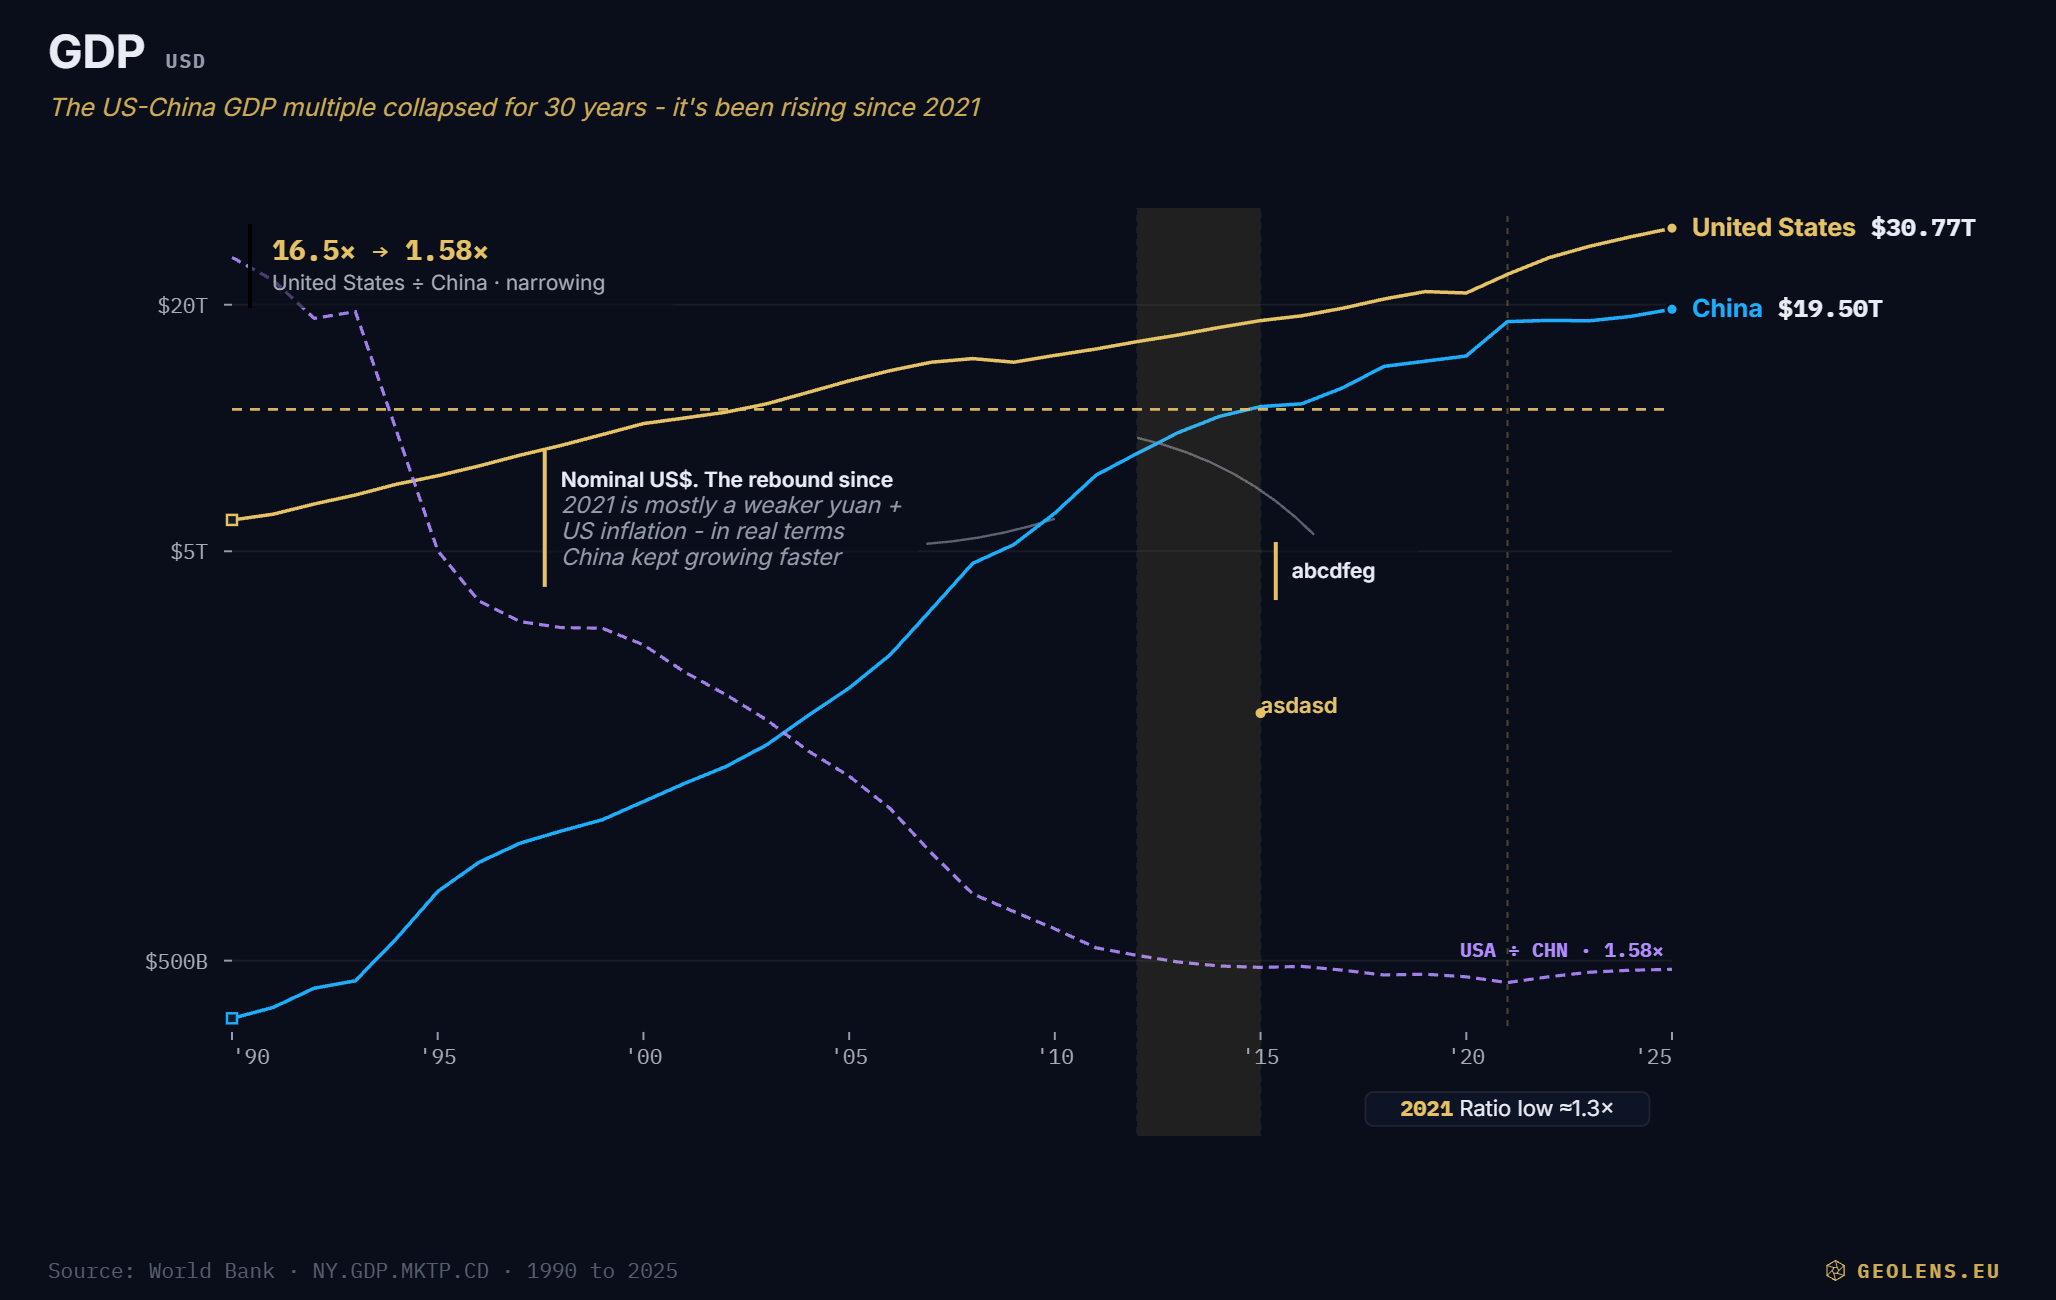
GDP · 2 countries
Data: World Bank · 2 countries · 1990 to 2025
| Country · USD | 1990 | 1991 | 1992 | 1993 | 1994 | 1995 | 1996 | 1997 | 1998 | 1999 | 2000 | 2001 | 2002 | 2003 | 2004 | 2005 | 2006 | 2007 | 2008 | 2009 | 2010 | 2011 | 2012 | 2013 | 2014 | 2015 | 2016 | 2017 | 2018 | 2019 | 2020 | 2021 | 2022 | 2023 | 2024 | 2025 |
|---|---|---|---|---|---|---|---|---|---|---|---|---|---|---|---|---|---|---|---|---|---|---|---|---|---|---|---|---|---|---|---|---|---|---|---|---|
| United States | 5,963,144,000,000 | 6,158,129,000,000 | 6,520,327,000,000 | 6,858,559,000,000 | 7,287,236,000,000 | 7,639,749,000,000 | 8,073,122,000,000 | 8,577,552,000,000 | 9,062,817,000,000 | 9,631,172,000,000 | 10,250,952,000,000 | 10,581,929,000,000 | 10,929,108,000,000 | 11,456,450,000,000 | 12,217,196,000,000 | 13,039,197,000,000 | 13,815,583,000,000 | 14,474,228,000,000 | 14,769,862,000,000 | 14,478,067,000,000 | 15,048,971,000,000 | 15,599,732,000,000 | 16,253,970,000,000 | 16,880,683,000,000 | 17,608,138,000,000 | 18,295,019,000,000 | 18,804,913,000,000 | 19,612,102,000,000 | 20,656,516,000,000 | 21,539,982,000,000 | 21,375,281,000,000 | 23,725,645,000,000 | 26,054,614,000,000 | 27,811,517,000,000 | 29,298,013,000,000 | 30,769,700,000,000 |
| China | 361,560,229,446 | 384,510,452,962 | 428,502,354,788 | 446,557,291,212 | 566,929,539,493 | 738,190,896,228 | 868,523,936,530 | 967,753,570,435 | 1,037,134,141,760 | 1,103,843,203,576 | 1,223,754,919,971 | 1,355,036,590,252 | 1,489,821,682,051 | 1,683,903,309,844 | 1,984,196,551,300 | 2,317,551,298,052 | 2,791,498,472,804 | 3,604,055,822,572 | 4,667,346,414,522 | 5,189,577,094,998 | 6,192,564,874,453 | 7,671,757,207,851 | 8,673,664,713,189 | 9,743,124,247,267 | 10,674,533,168,257 | 11,280,814,787,469 | 11,456,024,084,962 | 12,537,559,062,283 | 14,147,765,772,964 | 14,560,167,101,283 | 14,996,414,166,715 | 18,201,698,719,564 | 18,316,765,021,690 | 18,270,356,654,533 | 18,729,668,435,848 | 19,498,039,388,043 |
About GDP
Gross Domestic Product: the total market value of all final goods and services a country produces in a year, in current US dollars.
A measure of the size of an economy, not its wealth per person. Bigger means a larger economy overall; to compare living standards across countries use GDP per capita instead.
Country profiles:United StatesChina