Skip to content
GEOLENS
ExamplesPricing
Start free

Energy and climate

5 charts and races.

AllEconomy and tradePeopleEnergy and climate
Watch 1:05

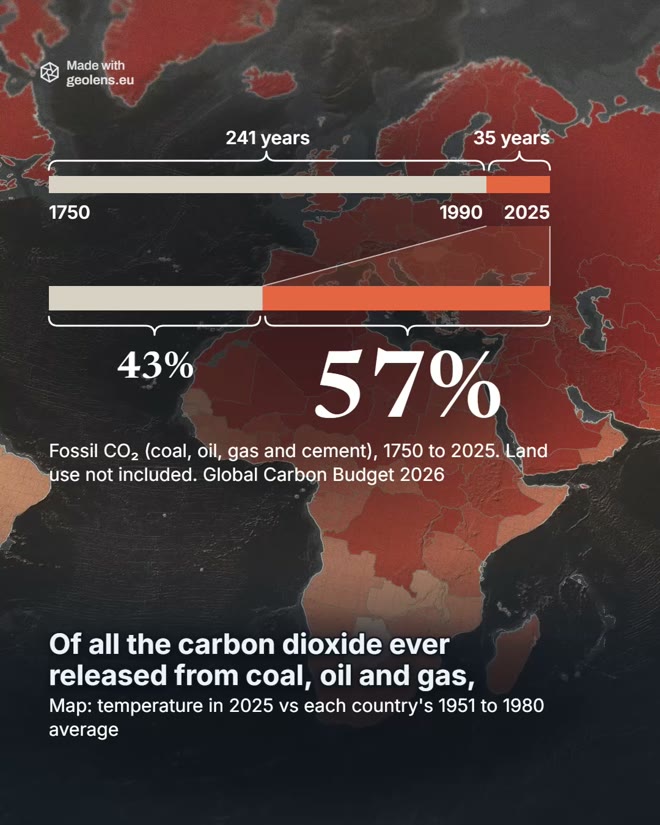
57% of all the carbon dioxide from fossil fuels went up after 1990

Who put it there, the US or China, depends on how you count.

Read the story
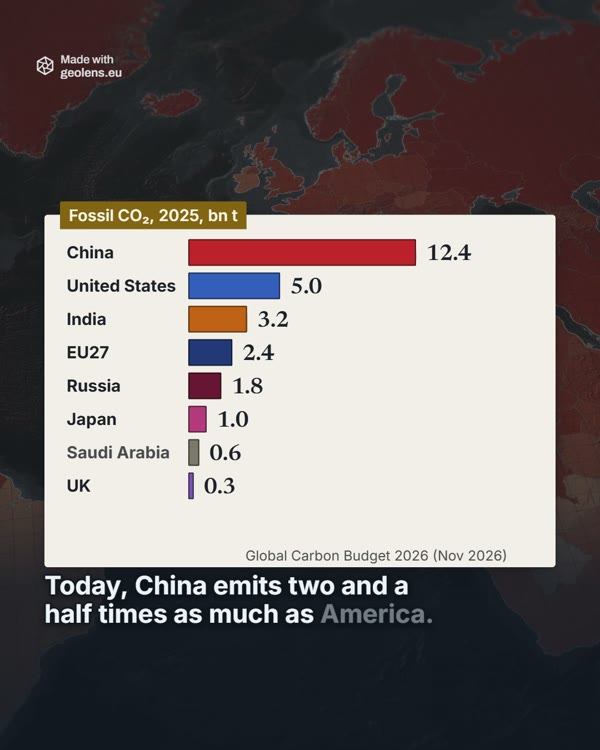
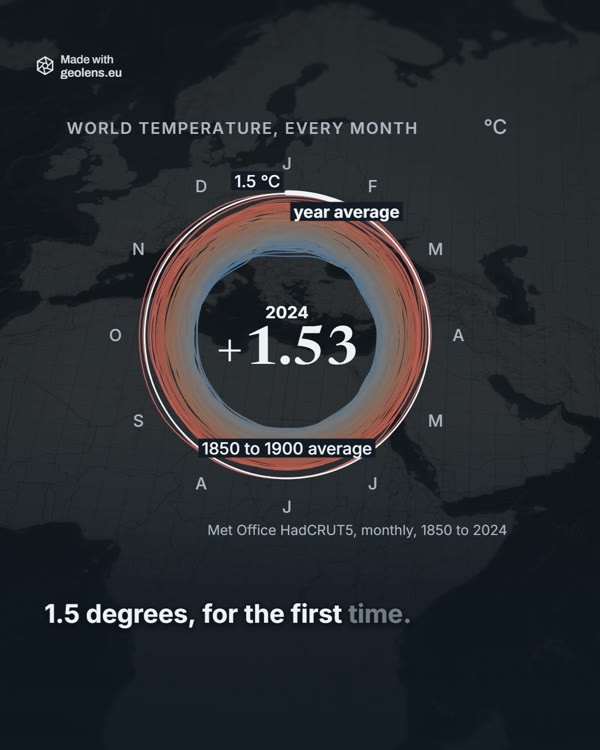
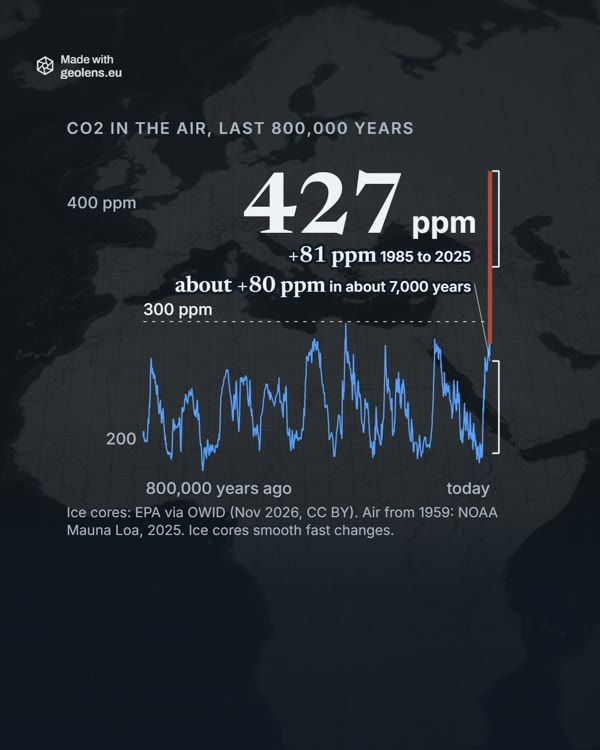
Read this part12.4 bn t China's fossil CO₂ in 2025, more than the US, India and the EU27 togetherRead this part+1.53 °C the world's 2024 average against 1850 to 1900 (Met Office)Read this part427 ppm CO₂ in the air in 2025; for 800,000 years before 1800 it stayed under 300
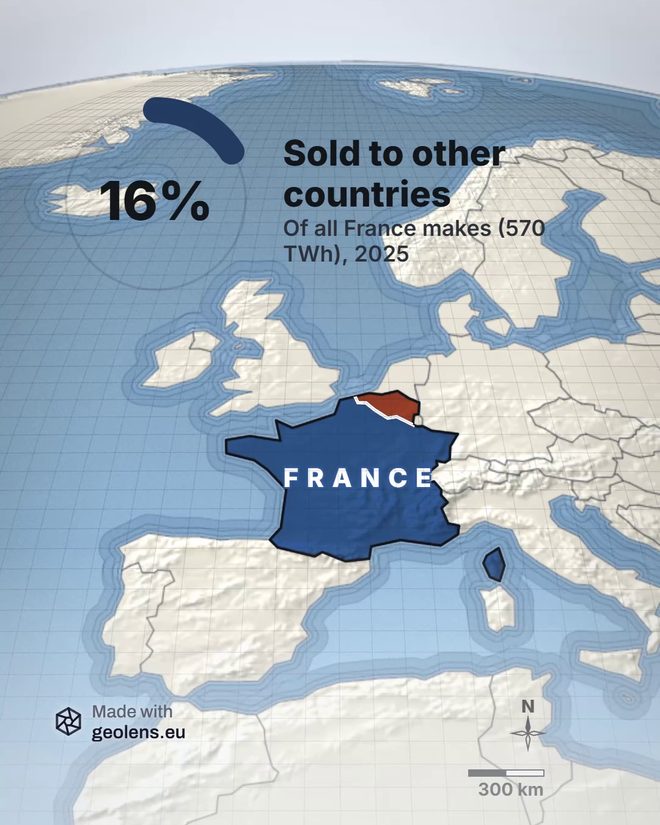
  • 7 Nov 2026 · Energy and climateFrance is the world's biggest seller of electricityNuclear plants, the grid and the cables abroad

Data notes

  • 8 Nov 2026Greece all but quit coal power in nine years
  • 2 Nov 2026The Netherlands against Europe's big four on energy imports
  • 1 Nov 2026Only Luxembourg in the EU emits more CO2 per head than China
  • 30 Oct 2026The race to emit the most CO2 from power plants
  • 26 Oct 2026China against the rich world on power per person
GEOLENS
Start free

Product

  • Charts
  • Maps
  • Race videos
  • Line charts
  • Bar chart races
  • Scatter plots
  • Heatmaps
  • Social posts
  • Examples

Use it for

  • Newsrooms
  • Reports
  • Classroom
  • Social media

Learn

  • Docs
  • Data sources
  • Countries
  • Stories
  • Developers

GeoLens

  • Pricing
  • Compare
  • About
  • © 2026 GeoLens
  • Privacy
  • Terms
hello@geolens.eu